Charles-Henry Monchau

Chief Investment Officer

Chart #1 — 

The comeback of stagflation fears

This chart alone explains why market sentiment has deteriorated in recent weeks: global economic growth forecasts are down, while inflation forecasts are up. After the very clear deflationary trend seen in the 1st half of the year, the specter of stagflation is once again looming, weighing on investor morale.

Global GDP growth forecasts (red line) vs. weighted 12-month rolling global inflation (blue line)

Syz-Feature_WeekIn7Charts_231002_i01

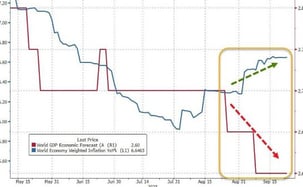
source: Bloomberg, www.zerohedge.com


Chart #2 — 

US 10-year yields at their highest since 2017

The yield on 10-year US Treasury bonds continues to rise, reaching a high of 4.63% last week, its highest level since June 2007. Since the Fed's last meeting last week, the yield on 10-year bonds has risen by 35 basis points. Since the Fed's last rate hike in July, the yield has risen by 60 basis points. In the meantime, the Fed's rate hike forecasts have not changed. In fact, the current yield curve has revised downwards the probability of another rate hike this year. How can we explain the upward acceleration in 10-year yields? Firstly, the market seems to have accepted that the Federal Reserve will take a long pause. Previously, investors were expecting a large number of rate cuts as early as 2024. The current curve now anticipates just two rate cuts next year. 

In addition, strong bond issuance by the US Treasury at a time when the Federal Reserve is accelerating the reduction in the size of its balance sheet through Quantitative Tightening (QT) is creating unfavourable supply/demand conditions for long-dated bonds. This upward movement in bond yields is contributing to the rise in the dollar and weighing on equity valuations, particularly those of so-called growth stocks (e.g. Technology).

Yield to maturity on 10-year US Treasury bonds (last 5 years)
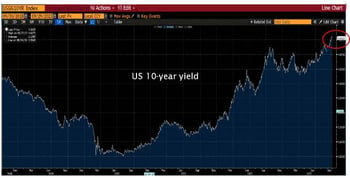
Syz-Feature_WeekIn7Charts_231002_i02

Source:  Bloomberg


Chart #3 — 

Not a single analyst sees the US 10-year rising above 5% over the next 6 months

Surprisingly, not a single broker is forecasting US 10-year yields above the 5% threshold over the next two quarters. Whether the consensus is right or wrong, such a level of optimism in a market as important as the long-rate market is questionable. If economic growth and/or the inflation rate were to surprise on the upside, the adjustment could be swift and brutal.

Analysts' forecasts for the yield on 10-year US Treasury notes - Q4 2023 vs. Q1 2024
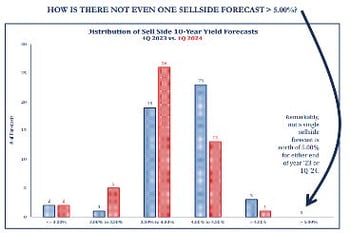
Syz-Feature_WeekIn7Charts_231002_i03

Source: Strategas


Chart #4 — 

Strong dichotomy between TLT ETF 
performance and buy flows

Another chart illustrates the complacency of investors in the bond markets: the change in assets under management of the index tracker (iShares 20+ year Treasury Bond), an ETF that replicates the performance of long-dated US sovereign bonds.
This ETF has just closed at its lowest level since February 2011. It is now down 50% on the high reached just 3 years ago, in 2020. Yet investors are still desperately pouring money into this ETF. It is quite rare to see an ETF record so many inflows (16 billion since the start of the year) despite such a significant and linear decline. The latest ETF to exhibit a similar dichotomy is one that replicates the performance of Chinese internet stocks. Investors are a long way from getting their money back…

Prices (red line) versus assets under management (white line)

Syz-Feature_WeekIn7Charts_231002_i04

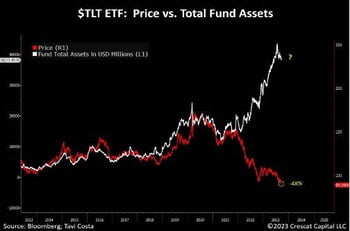
Source: Bloomberg, Crescat Capital


Chart #5 — 

Rising bond yields weigh on equity markets

The yield differential between 10-year US bonds and the S&P 500 dividend yield is at its widest since the great financial crisis of 2008. Admittedly, the relative price of the S&P 500 is mainly due to the very high valuation ratios of large-cap technology stocks. Nevertheless, the rise in bond yields is a definite attraction for many investors, who are arbitraging part of their equity exposure in favour of the bond markets.

Bond yields are now well above the S&P 500 dividend yield
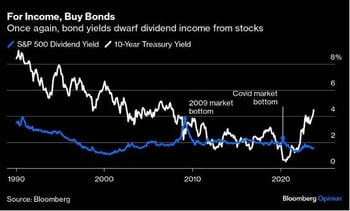
Syz-Feature_WeekIn7Charts_231002_i05

Source: Bloomberg


Chart #6 — 

Should we buy the equity markets after the latest rate hike?

Based on historical data, how did the Dow Jones perform in the months following the Federal Reserve's last rate hike? According to a Bank of America study, it all depends on the inflationary context. When inflation is too high and the monetary authorities are forced to extend their tightening efforts through channels other than interest rates (the scenario that took place in the 70s and 80s), the Dow Jones generally performs negatively in the 3 and 6 months following the Fed's last rate hike. On the other hand, in periods of disinflation, equity markets have performed very well. Even though we may have seen the end of the rate hike cycle, the markets will continue to pay close attention to forthcoming macroeconomic figures. Indeed, if inflation proves to remain top-heavy, we can expect a rise in volatility on the equity markets. 

How will the Dow Jones perform after the Fed's latest rate hike? 

Syz-Feature_WeekIn7Charts_231002_i06

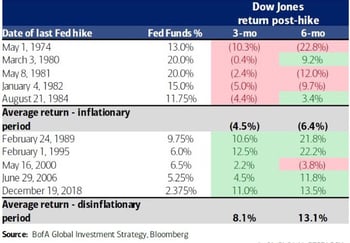
Source: BofA Global Investment Strategy, Bloomberg


Chart #7 — 

Have you ever heard of de-euroisation?

Numerous studies are predicting the imminent de-dollarisation of the planet, i.e., the reduction in the use of the US dollar as a currency of exchange by the use of other international currencies. According to the latest figures published by SWIFT (the system that enables you to make international transfers), it is not so much the dollar that is losing ground as the euro. In fact, the euro's share of the SWIFT global payment system has fallen from 28% at the start of the year to 23%. Why has the euro taken such a tumble? Are the Russian (SPFs) and Chinese (CIPS) payment systems taking market share from the single currency? The relative importance of these systems remains very small, but it is worth noting that the Chinese CIPS system reached its highest level in terms of market share in August (3.5%). 

Share of Payments via SWIFT in EUR (%)
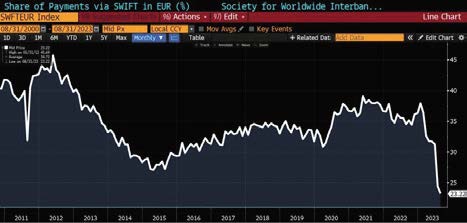
Syz-Feature_WeekIn7Charts_231002_i08

Source: Bloomberg


Disclaimer

This marketing document has been issued by Bank Syz Ltd. It is not intended for distribution to, publication, provision or use by individuals or legal entities that are citizens of or reside in a state, country or jurisdiction in which applicable laws and regulations prohibit its distribution, publication, provision or use. It is not directed to any person or entity to whom it would be illegal to send such marketing material. This document is intended for informational purposes only and should not be construed as an offer, solicitation or recommendation for the subscription, purchase, sale or safekeeping of any security or financial instrument or for the engagement in any other transaction, as the provision of any investment advice or service, or as a contractual document. Nothing in this document constitutes an investment, legal, tax or accounting advice or a representation that any investment or strategy is suitable or appropriate for an investor's particular and individual circumstances, nor does it constitute a personalized investment advice for any investor. This document reflects the information, opinions and comments of Bank Syz Ltd. as of the date of its publication, which are subject to change without notice. The opinions and comments of the authors in this document reflect their current views and may not coincide with those of other Syz Group entities or third parties, which may have reached different conclusions. The market valuations, terms and calculations contained herein are estimates only. The information provided comes from sources deemed reliable, but Bank Syz Ltd. does not guarantee its completeness, accuracy, reliability and actuality. Past performance gives no indication of nor guarantees current or future results. Bank Syz Ltd. accepts no liability for any loss arising from the use of this document.

Read More

Straight from the Desk

Syz the moment

Live feeds, charts, breaking stories, all day long.

Thinking out loud

Sign up for our weekly email highlighting the most popular posts.

Follow us

Thinking out loud

Investing with intelligence

Our latest research, commentary and market outlooks