
.png)
Source: CharlieBiello
We are sorry that for legal reasons we are not able to help US citizens or Canadian residents other than in Ontario, Quebec, or Alberta. Best wishes for the future…
We are sorry that for legal reasons we are not able to help US citizens or Canadian residents other than in Ontario, Quebec, or Alberta. Best wishes for the future…
You chose the following profile. If you made a mistake, please change here USA
This marketing document has been issued by Bank Syz Ltd. It is not intended for distribution to, publication, provision or use by individuals or legal entities that are citizens of or reside in a state, country or jurisdiction in which applicable laws and regulations prohibit its distribution, publication, provision or use. It is not directed to any person or entity to whom it would be illegal to send such marketing material.
This document is intended for informational purposes only and should not be construed as an offer, solicitation or recommendation for the subscription, purchase, sale or safekeeping of any security or financial instrument or for the engagement in any other transaction, as the provision of any investment advice or service, or as a contractual document. Nothing in this document constitutes an investment, legal, tax or accounting advice or a representation that any investment or strategy is suitable or appropriate for an investor's particular and individual circumstances, nor does it constitute a personalized investment advice for any investor.
This document reflects the information, opinions and comments of Bank Syz Ltd. as of the date of its publication, which are subject to change without notice. The opinions and comments of the authors in this document reflect their current views and may not coincide with those of other
Syz Group entities or third parties, which may have reached different conclusions. The market valuations, terms and calculations contained herein are estimates only. The information provided comes from sources deemed reliable, but Bank Syz Ltd. does not guarantee its completeness, accuracy, reliability and actuality. Past performance gives no indication of nor guarantees current or future results. Bank Syz Ltd. accepts no liability for any loss arising from the use of this document.

Charles-Henry Monchau
Chief Investment Officer
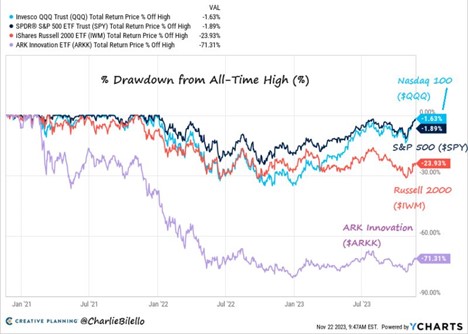
The Nasdaq 100 and S&P 500 ETFs are now within 2% of their all-time highs, while the Russell 2000 ETF (small caps) is 24% off its high and the ARK Innovation ETF is 71% off its high. In 2024, will we see market segments lagging in performance catch up?
Source: CharlieBiello
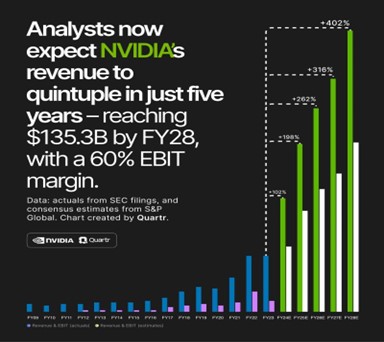
Nvidia has reported exceptional results for the third quarter, with a threefold increase in sales driven by the boom in artificial intelligence chips. Revenues from data centers were up 279%, while those generated by chips for electronic games were up 81%. Operating profit was up 1.633% year-on-year.
On the downside, the company warned analysts of a “significant” slowdown in demand from China. This news displeased the market, as the share price fell slightly after the results. This is the first time such an event has occurred since the ChatGPT buzz began.
Note that the market remains very optimistic about Nvidia’s future growth. The consensus is for sales to quintuple over the next 5 years, and operating margin to reach 60%.
Source: Quartr
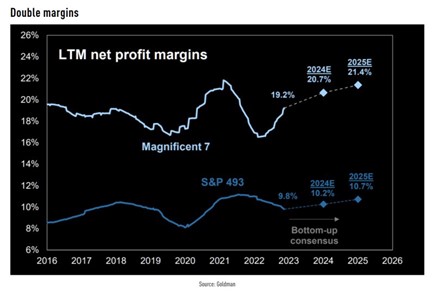
The “Magnificent 7” (Apple, Amazon, Alphabet, Meta, Microsoft, Nvidia, Tesla) alone have contributed 90% of the S&P 500’s year-to-date performance. They now account for almost 50% of the Nasdaq 100’s market capitalisation. Is this dominance justified by fundamentals? As a Goldman Sachs study shows, these companies are growing and making money well above the market average. Sales grew by 15% a year between 2013 and 2019, and by 18% annualised over the period 2021-2022. By way of comparison, that of other S&P 500 stocks was 2% and 15% respectively over the two aforementioned periods. The net margin of these companies is also well above that of the rest of the market. It currently stands at 19.2%, compared with 9.8% for the S&P 493. According to consensus expectations, this gap could continue to widen in the years ahead.
The strong fundamentals of the Magnificent 7 are also reflected in the valuation multiples. On the basis of expected 12-month earnings, these technology mega-caps have an average multiple of 29x, compared with 16x for the rest of the market.
Source: Goldman Sachs
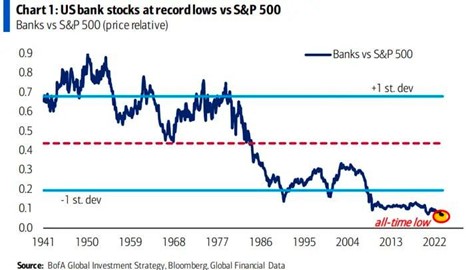
US bank stocks still haven’t recovered from the regional banking crisis of March. In relative terms, US bank shares are at historically low levels compared to the S&P 500 index. According to Moody’s, the major US banks currently have some $650 billion of unrealised losses on their bond portfolios on their balance sheets. The impending commercial real estate crisis poses a further threat to the US banking sector. This is particularly the case for small and medium-sized institutions, which currently hold around 70% of all commercial real estate loans in the US, including $1.5 trillion to be refinanced by 2025.
Source: BofA, Bloomberg
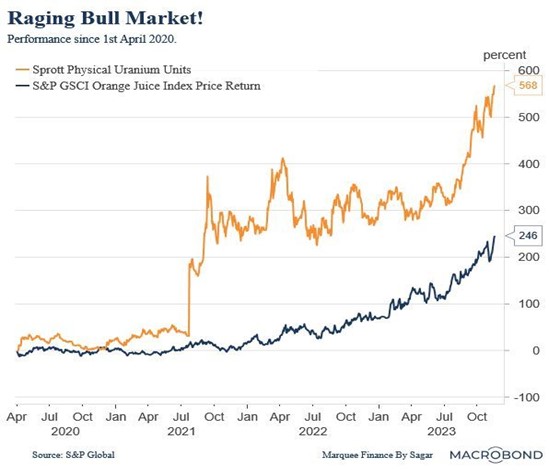
In the “post-covid” era, some active ingredients have outperformed even the Magnificent 7. This is particularly true of two raw materials: orange juice (+246%) and Uranium (+568%).
The tightness of the orange juice market in 2023 has led to record prices due to an imbalance between supply and demand. On the supply side, the global orange harvest has been declining for several years, due to several factors, including poor weather conditions, citrus greening disease and labour shortages. This decline in supply comes at a time when demand for orange juice has increased, due to its health benefits and popularity as a breakfast drink. The increase in demand has put additional pressure on the tight orange juice market.
As for Uranium, it topped $80 for the first time in over 15 years, an increase of almost 60% since the start of the year. Prices are now back above the levels seen before the Fukushima incident in March 2011. Uranium prices are strongly supported by a supply deficit in the coming years, particularly in the USA. At the same time, a long list of countries see nuclear power as one of the only alternatives to fossil fuels, and are planning to build a large number of nuclear power plants, which will greatly increase Uranium requirements. By 2028, a 60% supply/demand imbalance is expected.
Source: Macrobond, Sagar Singh Setia
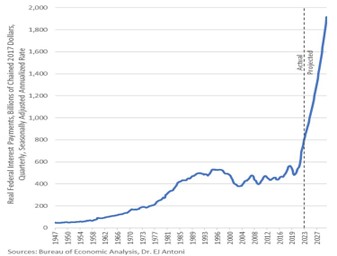
The U.S. government collects around $2.5 trillion a year in personal income tax. Of this, around $1,000 billion (40%) is absorbed by interest on the national debt. Debt interest is rising as old, cheap debt matures and is refinanced at higher rates. In addition, new debt is added every year. Indeed, new issues of US Treasuries are expected to rise by almost 25% next year. At this rate, within a few years, 100% of personal income tax revenues will be used to pay interest on the US national debt. Amount paid in interest on US debt.
Source: : BEA
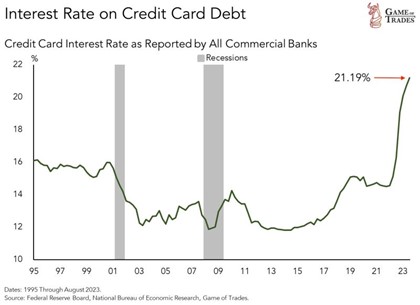
In the US, the interest rate on credit cards has risen to 21.19%. To put this in perspective, the rate was 14.56% at the start of 2022. That’s an increase of over 6% in less than two years. Current levels have not been reached for over 25 years. This comes at a time when credit card debt has crossed the $1 trillion threshold.
Source: Game of Trades
This marketing document has been issued by Bank Syz Ltd. It is not intended for distribution to, publication, provision or use by individuals or legal entities that are citizens of or reside in a state, country or jurisdiction in which applicable laws and regulations prohibit its distribution, publication, provision or use. It is not directed to any person or entity to whom it would be illegal to send such marketing material. This document is intended for informational purposes only and should not be construed as an offer, solicitation or recommendation for the subscription, purchase, sale or safekeeping of any security or financial instrument or for the engagement in any other transaction, as the provision of any investment advice or service, or as a contractual document. Nothing in this document constitutes an investment, legal, tax or accounting advice or a representation that any investment or strategy is suitable or appropriate for an investor's particular and individual circumstances, nor does it constitute a personalized investment advice for any investor. This document reflects the information, opinions and comments of Bank Syz Ltd. as of the date of its publication, which are subject to change without notice. The opinions and comments of the authors in this document reflect their current views and may not coincide with those of other Syz Group entities or third parties, which may have reached different conclusions. The market valuations, terms and calculations contained herein are estimates only. The information provided comes from sources deemed reliable, but Bank Syz Ltd. does not guarantee its completeness, accuracy, reliability and actuality. Past performance gives no indication of nor guarantees current or future results. Bank Syz Ltd. accepts no liability for any loss arising from the use of this document.
Meanwhile, Wall Street's long-term earnings expectations for the S&P 500 are now at record levels. Each week, the Syz investment team takes you through the last seven days in seven charts.
Meanwhile, corporate leadership is evolving rapidly: only 135 of the S&P 500 constituents from 1996 are still in the index today, while the EU goods trade deficit with China is close to a record €376bn. Each week, the Syz investment team takes you through the last seven days in seven charts.
Meanwhile, Trump’s personal crypto earnings in 2025 topped the combined profits of every publicly listed US crypto company. Each week, the Syz investment team takes you through the last seven days in seven charts.
Live feeds, charts, breaking stories, all day long.
Our latest research, commentary and market outlooks