Charles-Henry Monchau

Chief Investment Officer

Chart #1 — 

Sharp divergence
between gold and oil

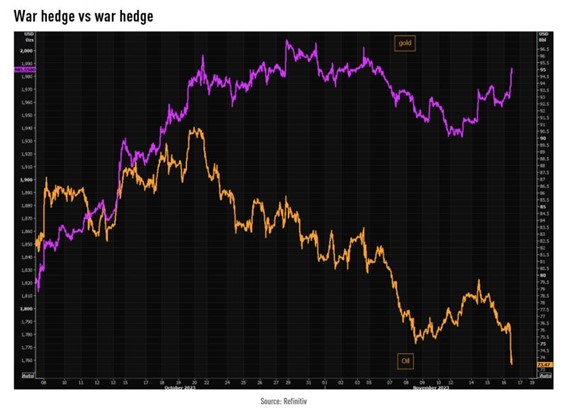
When the conflict between Israel and Hamas broke out, two assets were seen as the best portfolio hedges by investors. These were gold (purple line below) and oil (yellow line). Yet these two assets have behaved very differently over the past 3 weeks. How can we explain this dichotomy? The fall in oil values reflects the fact that the conflict in the Middle East probably won’t spread to oil-producing countries. It is also possible that the fall reflects market fears of a sharp drop in demand in 2024 due to the slowdown in global economic growth. What about gold? One hypothesis: investors see the precious metal as a safe-haven asset against a backdrop of declining confidence in central banks and the political chaos currently reigning in Washington.

W7C_231120_i01

Source: TME


Chart #2 — 

Towards a year-end rally?

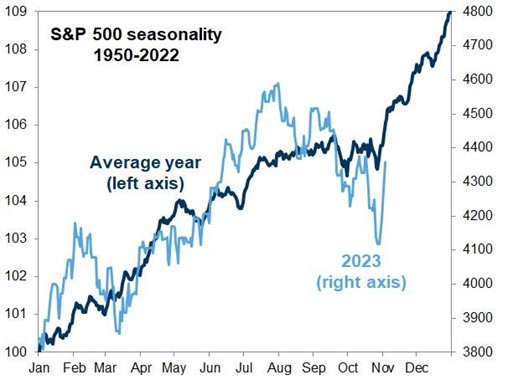
November and December are historically bullish months for equity markets. This is the famous end-of-year rally. Among the reasons for this seasonal phenomenon are financial flows: this is the period when companies distribute dividends, employees pay bonuses, contributions to 401k plans (American pension funds) and so on. But this seasonal bias is also due to the fact that investors, governments, business leaders, etc. often have a more optimistic view of the economy and markets when it comes to projecting themselves into a new year. In addition, asset allocators and hedge fund managers tend to take on more risk at the end and beginning of a calendar year.
As the chart below shows, the S&P 500 was lagging the seasonal cycle. But it looks set to regain the historical trend.

W7C_231120_i02

Source: Goldman Sachs


Chart #3 — 

US October inflation undershoots expectations

This was the most eagerly awaited figure of the week. 
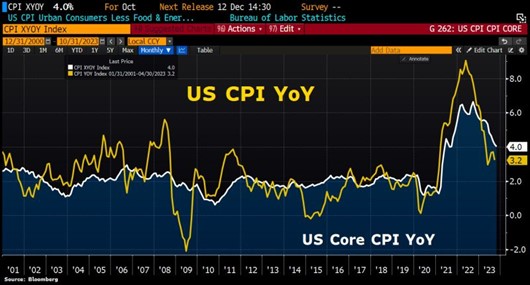
US inflation data for October came in below consensus expectations, confirming the disinflationary trend that began in mid-2022.The overall index fell from +3.7% (year-on-year) in September to +3.2% in October (versus +3.3% expected). The core index, which excludes energy and food, fell from 4.1% to 4.0% (versus +4.1% expected). In the previous two months, figures had turned out to be better than expected. As a result, October’s release reassured the markets and triggered a sharp fall in bond yields and the dollar.

W7C_231120_i03

Source: Bloomberg


Chart #4 — 

US real interest rates
are clearly positive

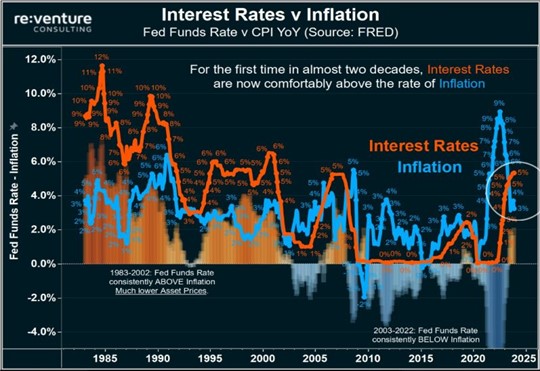
For the first time in almost twenty years, key US interest rates are now “comfortably” above inflation. As mentioned above, the US inflation rate is 3.2%, while the Fed’s key interest rates are 5.3%. Inflationary pressures should therefore continue to abate under the effect of a restrictive monetary policy.

W7C_231120_i04

Source: re:venture consulting


Chart #5 — 

The secular underperformance of 
international equities relative to U.S. equities

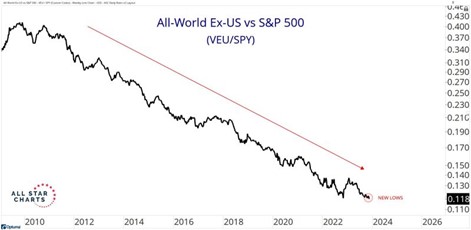
Is this the best long/short in history? International equity markets have consistently underperformed the US equity market over the past 15 years: the chart below shows the relative performance of the Vanguard FTSE All World ex-US ETF versus the SPDR S&P 500 ETF. Almost identical graphs appear for the “Value”/”Growth” pairs, strong outperformance of the “Growth” style, and small/mid-cap/large-cap pairs, strong outperformance of large-caps.

Historical performance is of course no guarantee of future performance.

W7C_231120_i05

Source: Steven Strazza


Chart #6 — 

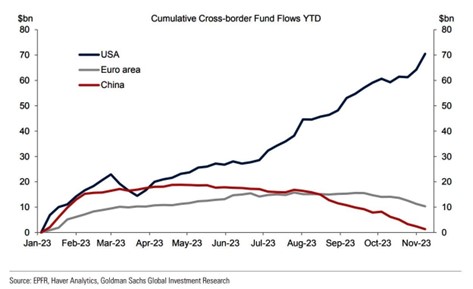
America continues to attract the vast majority of investment flows

An analysis of international fund flows shows that the US market continues to attract positive flows, while outflows are still the order of the day in the Eurozone and China. US dominance of capital markets is stronger than ever.

W7C_231120_i06

Source: : Bain analysis, Prequin


Chart #7 — 

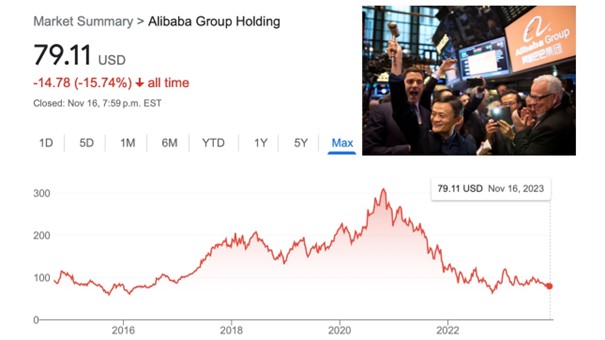
Alibaba loses up to $20 billion in market capitalization in a single session

Chinese e-commerce giant Alibaba saw its market capitalization slashed by $20 billion during Thursday’s trading session. The company, which competes with US tech giant Amazon, said that day that it would not proceed with the spin-off and listing of its cloud computing business, citing US export restrictions on so-called “advanced” semiconductors.
At the time of its U.S. IPO (September 19, 2014), Alibaba was the world’s fastest-growing retailer and was generating a lot of interest. 9 years have passed, and Alibaba’s stock market performance has been very disappointing. Indeed, if you had invested $10,000 at the time of the IPO, your investment would today be worth just $8,426. Over the same period, Alibaba’s sales have risen from $5.5 billion to $123.6 billion... Alibaba’s economic performance is therefore remarkable. But the valuation bubble has deflated considerably. You can buy the stock today for less than 10 times expected earnings in 2024.

W7C_231120_i07

Source: Trevor Scott/Tidefall Capital


Disclaimer

This marketing document has been issued by Bank Syz Ltd. It is not intended for distribution to, publication, provision or use by individuals or legal entities that are citizens of or reside in a state, country or jurisdiction in which applicable laws and regulations prohibit its distribution, publication, provision or use. It is not directed to any person or entity to whom it would be illegal to send such marketing material. This document is intended for informational purposes only and should not be construed as an offer, solicitation or recommendation for the subscription, purchase, sale or safekeeping of any security or financial instrument or for the engagement in any other transaction, as the provision of any investment advice or service, or as a contractual document. Nothing in this document constitutes an investment, legal, tax or accounting advice or a representation that any investment or strategy is suitable or appropriate for an investor's particular and individual circumstances, nor does it constitute a personalized investment advice for any investor. This document reflects the information, opinions and comments of Bank Syz Ltd. as of the date of its publication, which are subject to change without notice. The opinions and comments of the authors in this document reflect their current views and may not coincide with those of other Syz Group entities or third parties, which may have reached different conclusions. The market valuations, terms and calculations contained herein are estimates only. The information provided comes from sources deemed reliable, but Bank Syz Ltd. does not guarantee its completeness, accuracy, reliability and actuality. Past performance gives no indication of nor guarantees current or future results. Bank Syz Ltd. accepts no liability for any loss arising from the use of this document.
Read More

Straight from the Desk

Syz the moment

Live feeds, charts, breaking stories, all day long.

Thinking out loud

Sign up for our weekly email highlighting the most popular posts.

Follow us

Thinking out loud

Investing with intelligence

Our latest research, commentary and market outlooks