
.png)
 Source: Charlie Bilello
We are sorry that for legal reasons we are not able to help US citizens or Canadian residents other than in Ontario, Quebec, or Alberta. Best wishes for the future…
We are sorry that for legal reasons we are not able to help US citizens or Canadian residents other than in Ontario, Quebec, or Alberta. Best wishes for the future…
You chose the following profile. If you made a mistake, please change here USA
This marketing document has been issued by Bank Syz Ltd. It is not intended for distribution to, publication, provision or use by individuals or legal entities that are citizens of or reside in a state, country or jurisdiction in which applicable laws and regulations prohibit its distribution, publication, provision or use. It is not directed to any person or entity to whom it would be illegal to send such marketing material.
This document is intended for informational purposes only and should not be construed as an offer, solicitation or recommendation for the subscription, purchase, sale or safekeeping of any security or financial instrument or for the engagement in any other transaction, as the provision of any investment advice or service, or as a contractual document. Nothing in this document constitutes an investment, legal, tax or accounting advice or a representation that any investment or strategy is suitable or appropriate for an investor's particular and individual circumstances, nor does it constitute a personalized investment advice for any investor.
This document reflects the information, opinions and comments of Bank Syz Ltd. as of the date of its publication, which are subject to change without notice. The opinions and comments of the authors in this document reflect their current views and may not coincide with those of other
Syz Group entities or third parties, which may have reached different conclusions. The market valuations, terms and calculations contained herein are estimates only. The information provided comes from sources deemed reliable, but Bank Syz Ltd. does not guarantee its completeness, accuracy, reliability and actuality. Past performance gives no indication of nor guarantees current or future results. Bank Syz Ltd. accepts no liability for any loss arising from the use of this document.

Charles-Henry Monchau
Chief Investment Officer
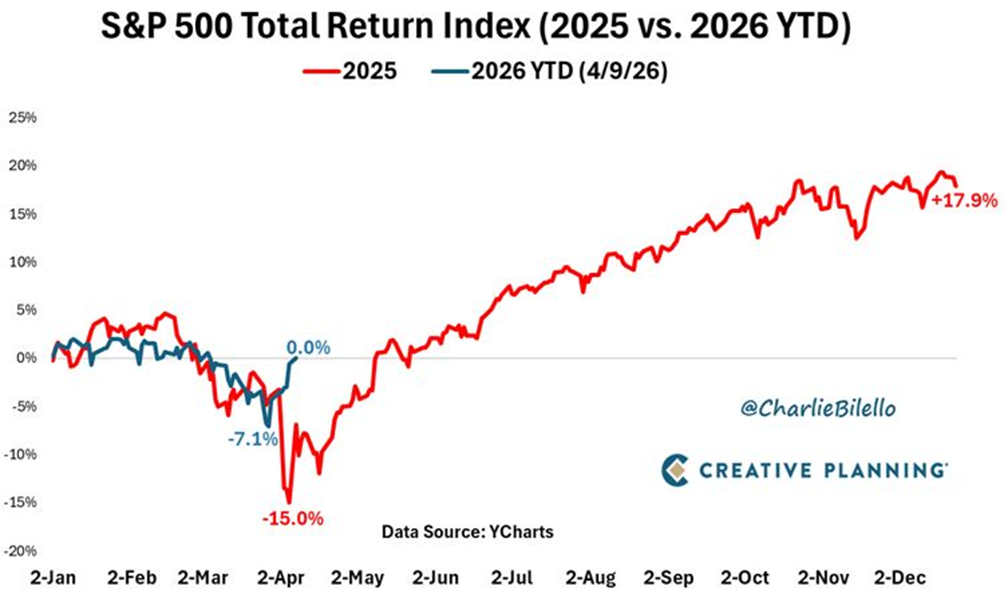
The S&P 500’s total return for the year has returned to zero. Despite all the recent volatility, the market has effectively ended up where it started, as if the fluctuations never occurred. The pattern closely mirrors what was observed in 2025.
Source: Charlie Bilello
The weakening of the dollar’s global dominance is unfolding gradually rather than suddenly. However, tensions in the Middle East represent another step in this long-term shift. One clear sign is that central banks now hold more gold than inflation-adjusted dollar reserves for the first time since the Bretton Woods II period.
 Source: Bloomberg, Macrobond
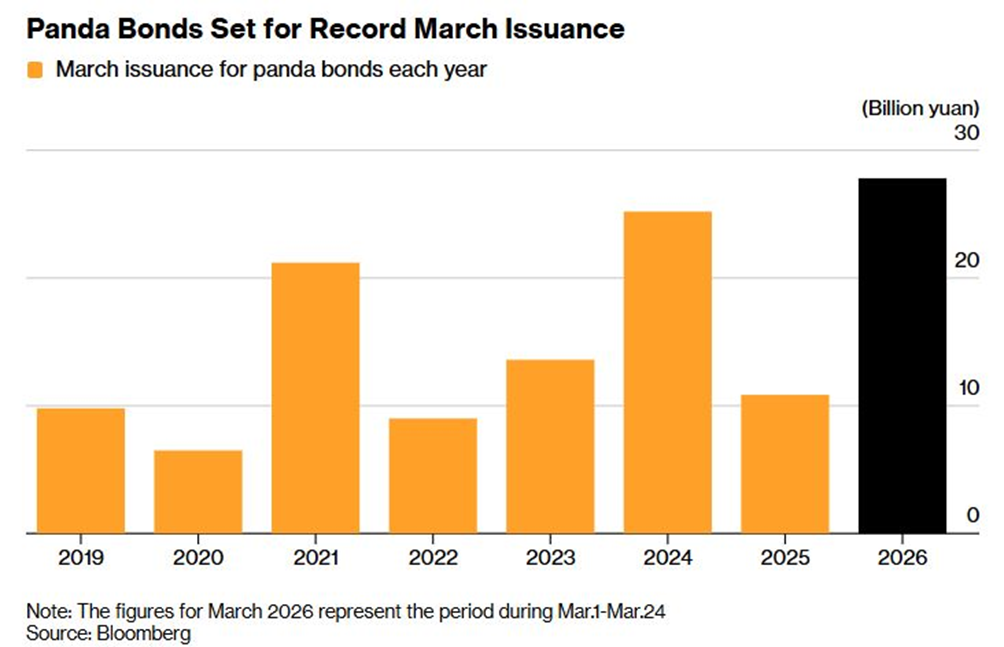
Since the Iran war began, international investors have sold $82bn worth of US Treasuries while increasing their exposure to panda bonds, which are yuan-denominated bonds issued in China by foreign entities. This shift is not driven by higher returns, as US 10-year yields stand at 4.4% compared to China’s 1.8%. Even during a major energy crisis, investors appear to favour Chinese bonds over US government debt.
Source: Bloomberg, Lukas Ekwueme
Over the last 15 years, several central banks have repatriated significant amounts of gold from the New York Fed, totalling 711.5 tonnes. This includes publicly disclosed transfers by Venezuela, the Netherlands, Germany, and France. Recently, the Bank of France finalised its process by relocating the last portion of its gold holdings back to Paris, achieving full domestic storage. Instead of physically transporting the gold, it sold older US-based bars and purchased updated standard gold in Europe between mid-2025 and early 2026, generating an estimated €13bn ($15bn) gain.
 Source: MINING.COM
Poland is rapidly increasing its gold reserves. In March alone, the National Bank of Poland added 11 tonnes, bringing total holdings to a record 582 tonnes. Since the start of the year, purchases have reached 31 tonnes, making Poland the most active central bank buyer of gold globally. Its reserves now exceed those of the European Central Bank, Portugal, and the United Kingdom. Ranked 12th worldwide, Poland holds the largest combined gold and foreign currency reserves in Central and Eastern Europe. In the current environment of geopolitical tension, sanctions, and currency instability, the country is relying heavily on gold as a safe store of value.
 Source: Global Markets Investor
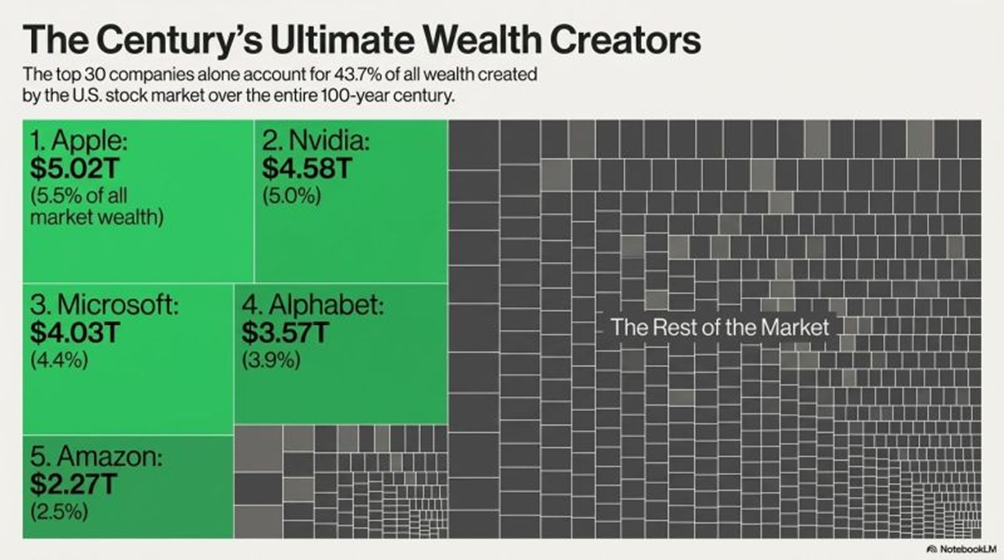
A recent study by Hendrik Bessembinder, analysing a century of stock market data, reveals a striking concentration of wealth creation. Among nearly 30,000 stocks examined, just 30 companies were responsible for approximately 44% of the total wealth generated over that period.
Source: Oktay Kavrak, CFA
Anthropic has experienced extraordinary growth, with revenue surging from $1bn to a $30bn annual run rate in less than a year. This rapid expansion reflects not just strong performance but an almost exponential trajectory.
Beyond revenue, the company’s real advantage lies in its control over computing infrastructure. It has secured massive amounts of processing capacity through major agreements with Google and Broadcom, ensuring future scalability. Its strategy spans multiple platforms, leveraging chips from AWS, TPUs from Google, and GPUs from NVIDIA across various cloud providers. This diversified approach reduces dependency risks and strengthens its overall ecosystem.
At the same time, enterprise adoption is accelerating rapidly. More than 1,000 companies now spend over $1mn annually on its solutions, and 8 of the Fortune 10 already use its Claude system. Even projections once considered ambitious have been surpassed well ahead of schedule, making future estimates appear increasingly conservative. Overall, artificial intelligence has moved beyond experimentation and is now a core part of global infrastructure, with Anthropic positioning itself as a key player in this transformation.
 Source: MilkRoad AI
This marketing document has been issued by Bank Syz Ltd. It is not intended for distribution to, publication, provision or use by individuals or legal entities that are citizens of or reside in a state, country or jurisdiction in which applicable laws and regulations prohibit its distribution, publication, provision or use. It is not directed to any person or entity to whom it would be illegal to send such marketing material. This document is intended for informational purposes only and should not be construed as an offer, solicitation or recommendation for the subscription, purchase, sale or safekeeping of any security or financial instrument or for the engagement in any other transaction, as the provision of any investment advice or service, or as a contractual document. Nothing in this document constitutes an investment, legal, tax or accounting advice or a representation that any investment or strategy is suitable or appropriate for an investor's particular and individual circumstances, nor does it constitute a personalized investment advice for any investor. This document reflects the information, opinions and comments of Bank Syz Ltd. as of the date of its publication, which are subject to change without notice. The opinions and comments of the authors in this document reflect their current views and may not coincide with those of other Syz Group entities or third parties, which may have reached different conclusions. The market valuations, terms and calculations contained herein are estimates only. The information provided comes from sources deemed reliable, but Bank Syz Ltd. does not guarantee its completeness, accuracy, reliability and actuality. Past performance gives no indication of nor guarantees current or future results. Bank Syz Ltd. accepts no liability for any loss arising from the use of this document.
Meanwhile, Wall Street's long-term earnings expectations for the S&P 500 are now at record levels. Each week, the Syz investment team takes you through the last seven days in seven charts.
Meanwhile, corporate leadership is evolving rapidly: only 135 of the S&P 500 constituents from 1996 are still in the index today, while the EU goods trade deficit with China is close to a record €376bn. Each week, the Syz investment team takes you through the last seven days in seven charts.
Meanwhile, Trump’s personal crypto earnings in 2025 topped the combined profits of every publicly listed US crypto company. Each week, the Syz investment team takes you through the last seven days in seven charts.
Live feeds, charts, breaking stories, all day long.
Our latest research, commentary and market outlooks