

.png)
Chart #1 —
U.S. PPI inflation data surprise on the
upside
The US inflation figures released in recent weeks had reassured investors, with most data coming in below expectations. But the Producer Price Index (PPI) for the month of November turned out to be above consensus with a 7.4% year-on-year increase vs. 7.2% expected (and vs. 8.1% the previous month). The core figure was +6.2% vs. +5.9% expected. On a sequential basis (see chart below), the PPI was +0.3% vs. +0.2% expected and +0.3% the previous month. The core index increased by 0.4% compared to 0.2% expected and 0.1% the previous month. On a sequential basis, it is therefore clear that the trend is moving back up, which was not appreciated by the markets.
US PPI figures on a sequential basis (blue) and excluding food and energy (orange)
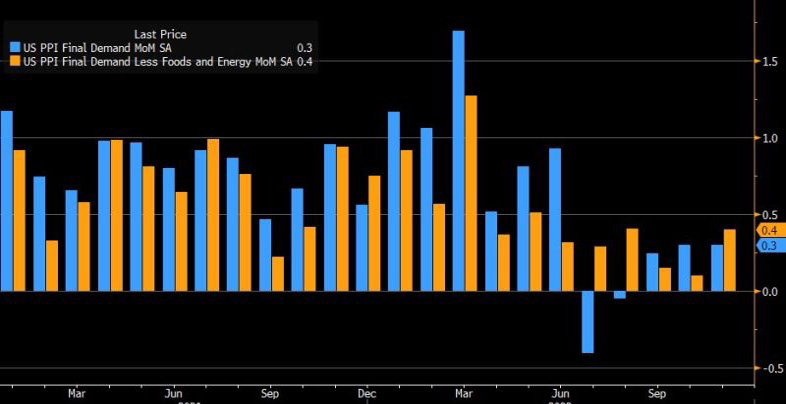
Source: Bloomberg
Chart #2 — S&P 500 fails to hold its 200-day moving average
The S&P 500 has once again failed to break the downtrend and is currently trading below the 200-day moving average. The technical setup does not look as favorable as it did a few weeks ago. Macro hedge funds have covered their short positions, systematic funds have net long positions (so watch out for a reversal if the selling intensifies) and corporate share buybacks are slowing down.
S&P 500, 200-day moving average and medium-term trend
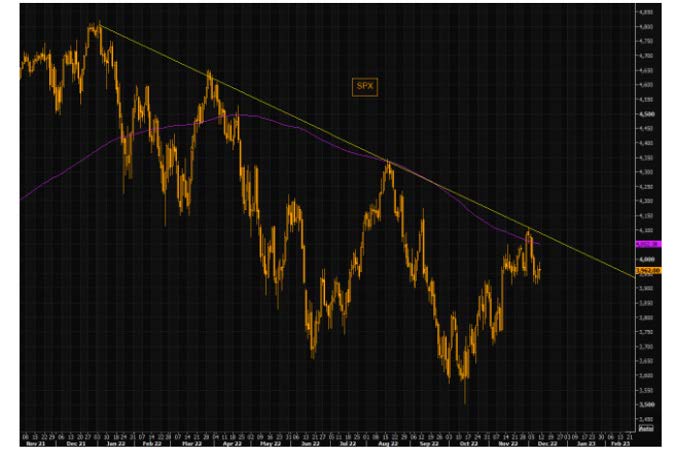
Source: Bloomberg
Chart #3 —
Defensive sectors have recently outperformed cyclical sectors
All sectors of the S&P 500 ended the week in the red, with energy stocks performing the worst by far (-7.9% versus -3.4% for the S&P 500). Defensive sectors have been outperforming for a little over two weeks, which is not a good signal for the market. The sustainability of the bull market must be confirmed by a more sustained leadership of cyclical sectors
Relative performance of cyclicals versus defensives
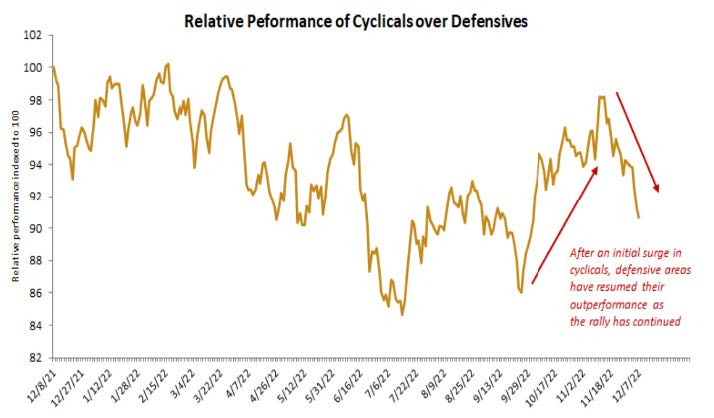
Source: Edward Jones
Chart #4 —
The S&P 500's sensitivity to earnings and 12-month P/E
Is there further downside risk to the S&P 500? The P/E (2023) of the S&P 500 is currently 17x, which is not cheap. In addition, the expected EPS (earnings per share) for 2023 seem overly optimistic (the consensus of +4% seems optimistic) and therefore could be revised downward.
In the event of a recession, the S&P 500 could reach levels between 3,000 and 3,400, a decline of 14% to 24% from current levels. In the event of a recession, there is indeed a downside risk for the S&P 500, especially if the Fed does not change its monetary policy (rate hikes tend to weigh on valuation multiples).
Level of the S&P 500 based on the level of expected earnings per share for 2023 and the 12-month P/E
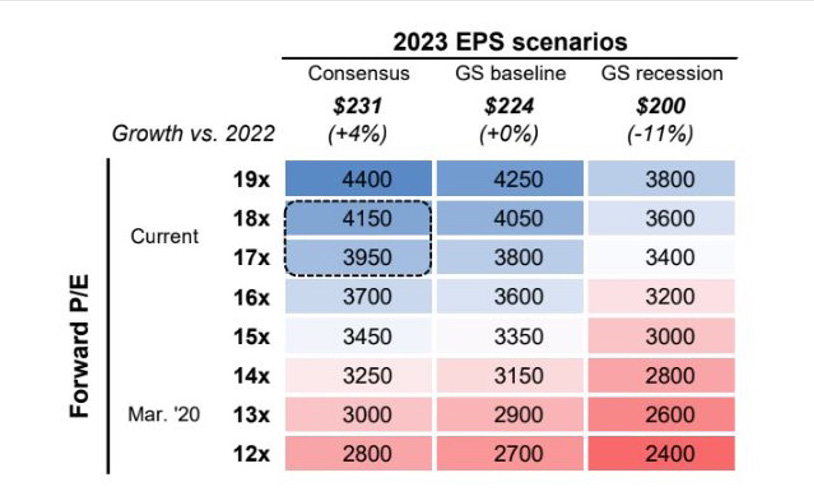
Source: Goldman Sachs
Chart #5 —
China's outperformance since early November
Since the beginning of November, the Hang Sang Index (orange) has strongly outperformed its international peers. In terms of other Chinese indices, technology stocks have surged as the market expects Beijing and U.S. regulators to reach an audit and inspection agreement. Another positive development is that Chinese government officials appear to be willing to ease the "zero-covid" restrictions that have crippled the world's second largest economy.
Shares of Chinese property developers rallied sharply, as easing measures in the real estate market are in sight ahead of China's central economic conference, which begins on December 15.
Performance of the Hang Seng index (orange), Shanghai Shenzen CSI 300 index (purple), Eurostoxx 50 (white) and S&P 500 (blue)

Source: Bloomberg
Chart #6 —
Has the gold/oil ratio reached a bottom?
Crude oil prices are now down 1% for the year after being up more than 60% at their peak in March. In an article, Bloomberg notes that fears of a global recession may rekindle demand for safe-haven assets, which is supporting the price of gold. Moreover, the gold/oil ratio continues to appreciate after collapsing since mid-2020.
Gold / Crude oil ratio

Source: Bloomberg
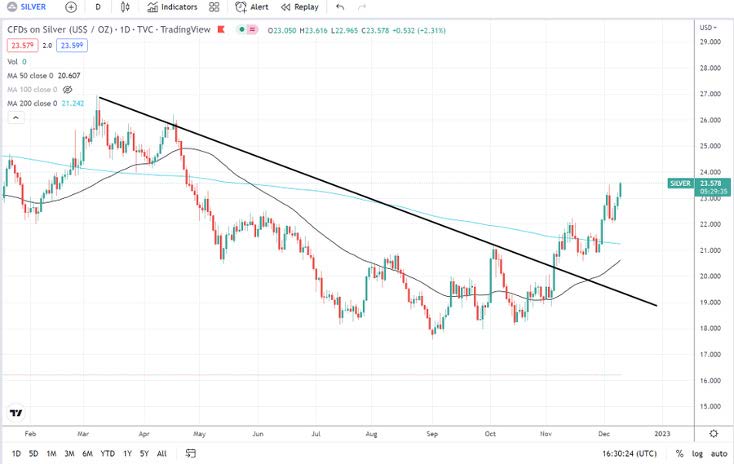
Chart #7 —
Soon a "golden cross" on silver?
Another week of bullishness for silver. The technical situation continues to improve as the 50-day moving average is about to cross the 200-day moving average to the upside. At the fundamental level, the political crisis in Peru - the world's 2nd largest silver producer - poses a significant risk to supply which is pushing prices higher.
Silver price trades above the 50-day moving average
Source: WallStreetSilver