Charles-Henry Monchau

Chief Investment Officer

Chart #1 — 

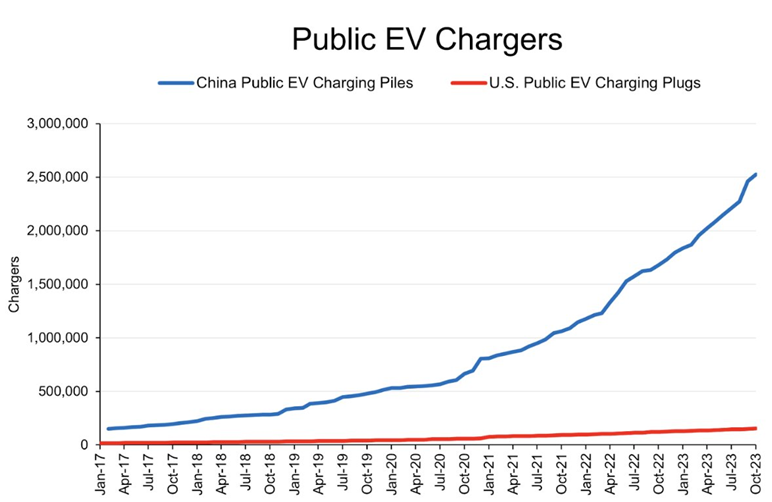
China is becoming the undisputed leader in electric cars


With the buzz created by artificial intelligence, electric cars are almost forgotten... And yet, the lines are moving in this ultra-promising yet highly competitive industry. Quietly, China is propelling electric vehicles (EVs) into another dimension. China currently has 2.5 million EV chargers, compared with just 130,000 in the USA. China has one charger for every 7 cars, while the USA has one charger for every 18 cars. What's more, Chinese EV chargers deliver 4 kilowatts per hour, compared with 1 kilowatt per hour in the USA. To put this into perspective, the difference in energy is equivalent to powering 17 standard light bulbs in the U.S. versus 67 in China. Needless to say, Europeans lag even further behind.


Source: The Kobeissi Letter


Chart #2  — 

Record monthly flows for bitcoin spot ETFs

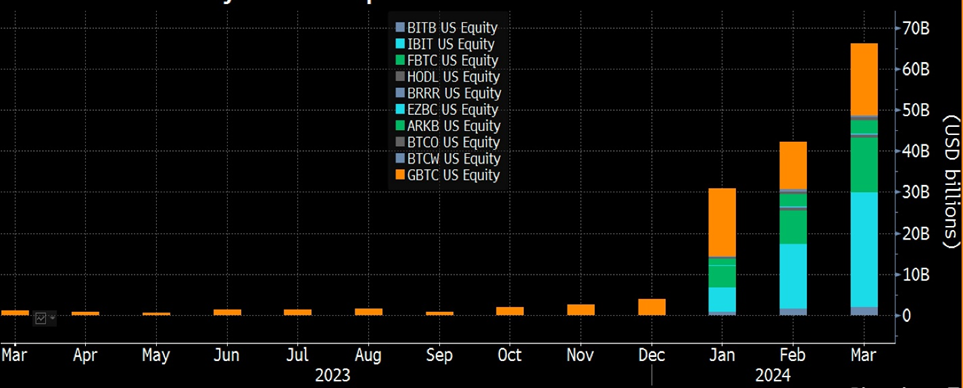
Here's the monthly volume for the ten spot bitcoin ETFs (Exchange Traded Funds). It's only mid-March, but inflows over the first two weeks have already smashed February's and January's figures, with $65 billion in net subscriptions. These ETF purchases are naturally having an impact on the price of bitcoin, which reached $73,000 on Wednesday before correcting at the end of the week.

Source:  Eric Balchunas, Bloomberg


Chart #3  — 

Who owns the bitcoins already mined?

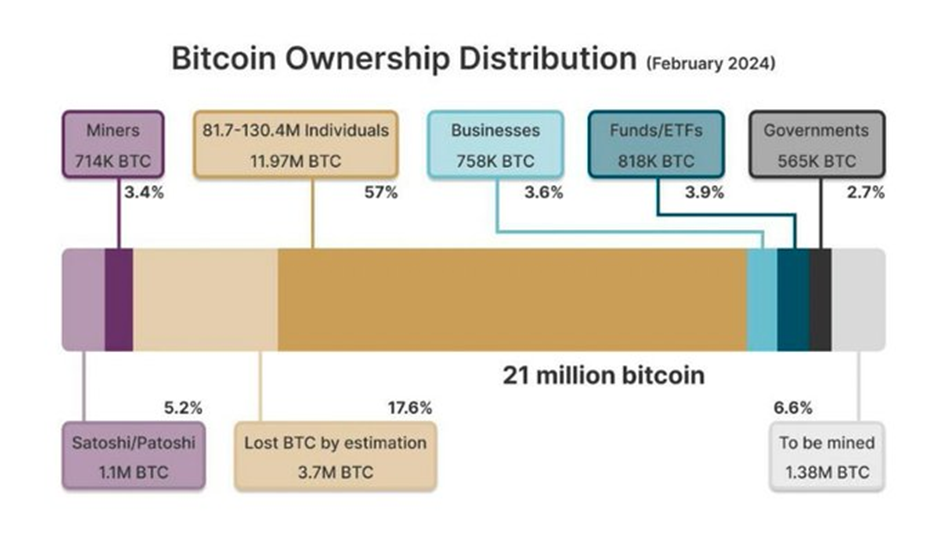
Here is the current distribution of bitcoin holders, bearing in mind that 1.38 million bitcoin still need to be mined in order to reach the maximum supply of 21 million bitcoin:

5.2% are held by the inventor(s) of bitcoin, 3.4% by miners, 57% by individuals, 3.6% by companies, 3.9% by funds and ETFs and 2.7% by governments. It is estimated that 17.6% of bitcoins created since 2009 have been lost .

Source: Eric Balchunas


Chart #4 — 

A looming liquidity crisis on bitcoin ?

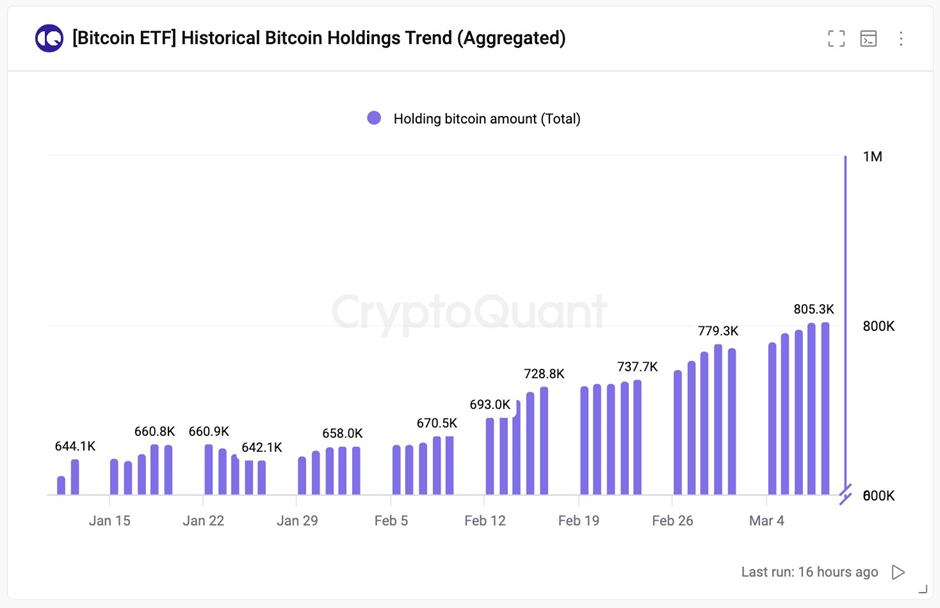
According to Cryptoquant analyst Ki Young Ju, bitcoin could experience a liquidity crisis by September. The cause: the available supply of bitcoin may no longer be able to meet the growing demand, with all the consequences this could have on the price.

Explanation

Bitcoin as an allocation "brick" in institutional and private portfolios has only just begun. As mentioned in Chart #2, bitcoin spot exchange-traded funds (ETFs) continue to record massive inflows. With almost $30 billion in assets under management 8 weeks after launch, this is quite simply the most successful ETF launch in history.

However, if the trend continues, a new phenomenon could occur, there won’t be enough bitcoin to keep up with demand. High demand for these ETFs is “forcing” asset managers to buy hundreds of thousands of bitcoins every week, even though the number of bitcoins available on exchanges and from miners is estimated at around 3 million. In this context, the potential for a price shock induced by a shortage of supply becomes real. At the current rate, a liquidity crisis, on the supply side, could occur within six months (September).

To avoid a liquidity crisis, the whales - i.e., the very large holders of bitcoin - need to start transferring their BTC to the exchanges and selling them. This should happen if the price of BTC reaches higher levels. The law of supply and demand, as it were.

Source: Cryptoquant


Chart #5 — 

1 trillion dollars in additional US debt in record time


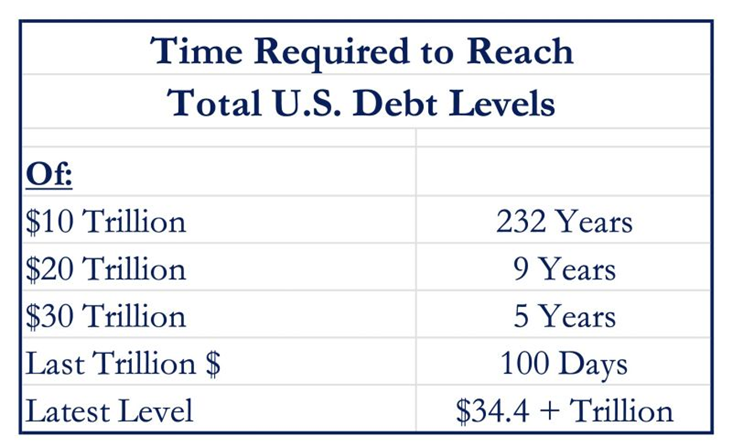
It took Uncle Sam 232 years to accumulate its first $10 trillion of debt, 9 years to accumulate another $10 trillion and 5 years for the next $10 trillion. The passage from $33 trillion to $34 trillion in debt was brief, taking just 100 days, from September to December 2023, according to Strategas calculations. That's what you might call an exponential rise !

Source : Strategas


Chart  #6 — 

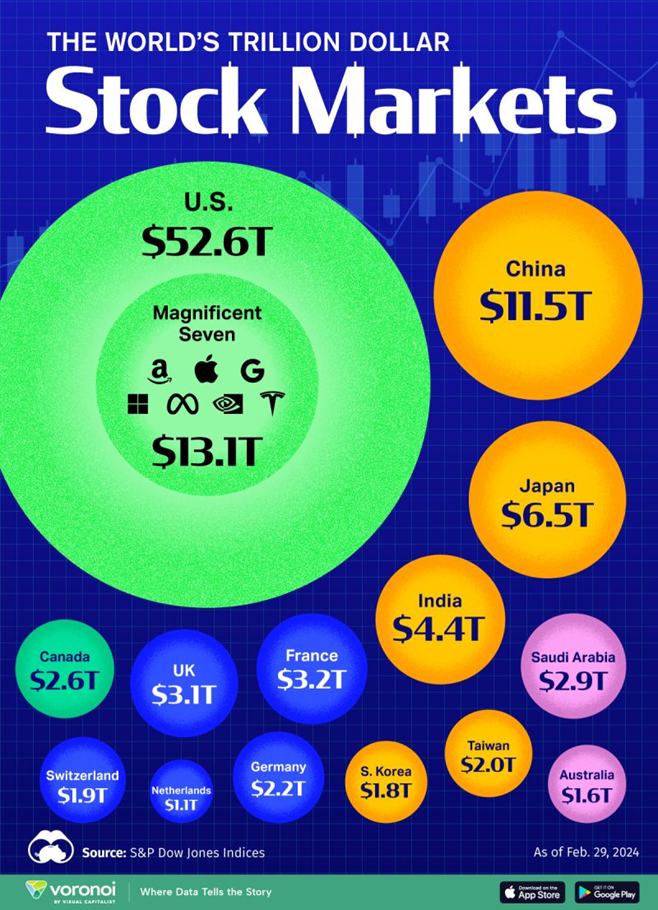
The world's largest stock markets

The size of the world's stock markets has almost tripled since 2003, reaching a total market capitalisation of $109,000 billion.

Over the past few decades, growth in the money supply and very low interest rates have supported rising asset values in all economies.

With the world's most developed and active capital markets, the United States accounts for 42.5% of global equity market capitalisation, far outstripping the European Union. Today, US equity markets represent a market capitalisation of over $46,200 billion.

Compared to other wealthy countries, US equities have often outperformed in recent decades. If an investor had invested $100 in the S&P 500 in 1990, that investment would have grown to around $2,000 by 2023 - four times the performance recorded in other developed countries. The second-largest equity market is the European Union, with 11.1% of the global share, followed by China, with 10.6%.

Over the past 20 years, China's economy has grown 12-fold, reaching $19.4 billion in 2023. Despite very mediocre performance in recent years, China's stock markets have also seen considerable growth, fuelled by the inclusion of Chinese domestic equities in the MSCI Emerging Market index in 2018, and earlier, with the internationalisation of its stock markets in 2002. Japan's equity markets account for 5.4% of the global share, followed by Hong Kong (4%).

Source: Visual Capitalist, S&P Dow Jones Indices


Chart #7 — 

Why you should invest in equity markets?

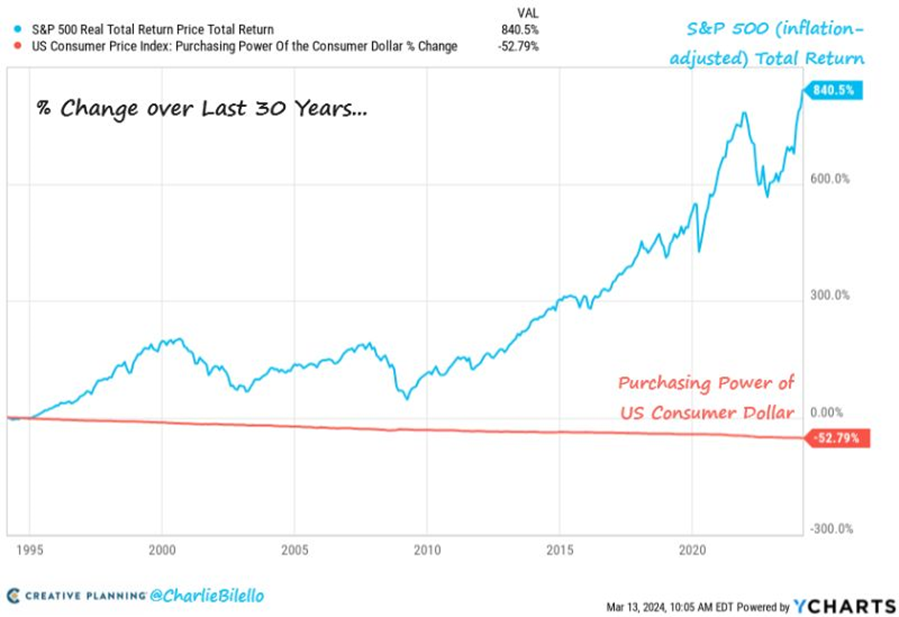
Over the past 30 years, the purchasing power of the US dollar has been halved by inflation. Over the same period, the S&P 500 has gained 840% (7.8% p.a.) in real terms (i.e., adjusted for inflation). In a regime of "monetary debasement" - i.e., erosion of purchasing power - the purchase of risky assets (equities, real estate) and value reserves (gold, etc.) is the best way for savers to protect the real value of their wealth.


Source: Charlie Bilello


Disclaimer

This marketing document has been issued by Bank Syz Ltd. It is not intended for distribution to, publication, provision or use by individuals or legal entities that are citizens of or reside in a state, country or jurisdiction in which applicable laws and regulations prohibit its distribution, publication, provision or use. It is not directed to any person or entity to whom it would be illegal to send such marketing material. This document is intended for informational purposes only and should not be construed as an offer, solicitation or recommendation for the subscription, purchase, sale or safekeeping of any security or financial instrument or for the engagement in any other transaction, as the provision of any investment advice or service, or as a contractual document. Nothing in this document constitutes an investment, legal, tax or accounting advice or a representation that any investment or strategy is suitable or appropriate for an investor's particular and individual circumstances, nor does it constitute a personalized investment advice for any investor. This document reflects the information, opinions and comments of Bank Syz Ltd. as of the date of its publication, which are subject to change without notice. The opinions and comments of the authors in this document reflect their current views and may not coincide with those of other Syz Group entities or third parties, which may have reached different conclusions. The market valuations, terms and calculations contained herein are estimates only. The information provided comes from sources deemed reliable, but Bank Syz Ltd. does not guarantee its completeness, accuracy, reliability and actuality. Past performance gives no indication of nor guarantees current or future results. Bank Syz Ltd. accepts no liability for any loss arising from the use of this document.
Read More

Straight from the Desk

Syz the moment

Live feeds, charts, breaking stories, all day long.

Thinking out loud

Sign up for our weekly email highlighting the most popular posts.

Follow us

Thinking out loud

Investing with intelligence

Our latest research, commentary and market outlooks