Charles-Henry Monchau

Chief Investment Officer

Chart #1 — 

US 12-month inflation continues to remain high in many segments of the 
economy

It was the week's most eagerly awaited macroeconomic figure, the US inflation rate for August. The headline inflation figures were in line with expectations (+0.6% on a sequential basis). This was the biggest monthly rise since June 2022 and the second consecutive monthly increase. The energy index rose by 5.6% in August after increasing by 0.1% in July. Airline fares underwent a major turnaround. They rose by 4.9% after falling by 8.1% over the previous two months. On a rolling 12-month basis (see chart below), the overall CPI index rose by 3.7%, slightly more than expected (3.6%).

The surprise came from the core index, which was slightly higher than expected (+0.3% on a sequential basis), an acceleration compared to July. This was mainly due to the housing index, which has risen by 7.3% over the past year, accounting for over 70% of the total increase in all items except food and energy. On a rolling 12-month basis, the Core index is up 4.3%, in line with expectations.

Syz-Feature_WeekIn7Charts_230918-1

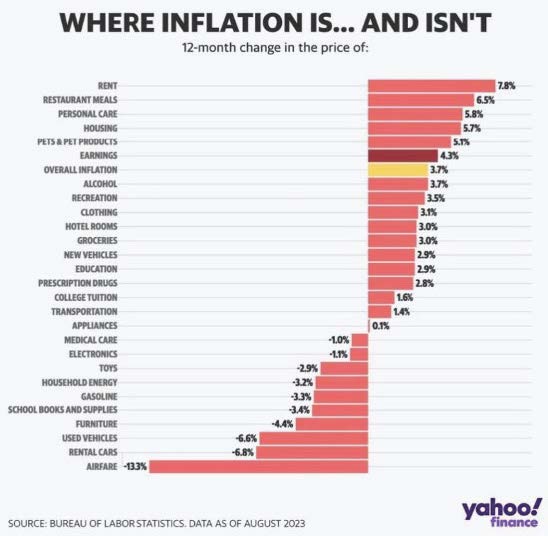
source: Yahoo Finance


Chart #2 — 

European key rates at their highest since the ECB was founded in 1999

The European Central Bank raised the deposit rate by 25 basis points to a record 4% on Thursday, with inflation risks outweighing economic gloom. Concerns about the dynamics of underlying inflation appear to have taken precedence over the negative (and worrying) dynamics of economic growth in Europe:

"Inflation continues to fall but is likely to remain too high for too long. The Governing Council is determined to ensure that inflation returns rapidly to its medium-term objective of 2%. In order to reinforce progress towards this objective, the Governing Council today decided to raise all three key ECB interest rates by 25 basis points."

pic 2

Source:  Bloomberg


Chart #3 — 

A tale of two S&P 500

It was a mixed week for US equity markets, with the S&P 500 and Nasdaq indices ending the week in slightly negative territory after Friday's profit-taking. Technology and growth stocks slightly underperformed the value style. Since the start of the year, the S&P 500 has continued to rise strongly, up 15.9%.

However, there is a strong dichotomy between the two categories of stocks. In fact, all the S&P 500's gains this year have come from the boom in AI-sensitive stocks, i.e., some very large caps such as Microsoft, Alphabet, Nvidia, Amazon and Apple. As for the rest of the market, it did not post any significant gains, reflecting concerns about the slowdown in global economic growth.

pic 3-Sep-18-2023-02-49-08-3566-PM

Source: Michel A.Arouet


Chart #4 — 

WTI oil closes above 90 dollars a barrel

WTI crude oil (the US benchmark) closed above $90 a barrel for the first time since last November and is now up 12% on the year and 40% from its summer low. In the US, petrol prices have risen by 11% in the last month and by 50% since 2020, with US oil reserves at their lowest level since 1983.

pic 4-Sep-18-2023-02-50-40-5971-PM

Source: Charlie Bilello, Bloomberg


Chart #5 — 

Oil supply deficit set to worsen in Q4

This chart from Bloomberg shows the huge supply deficit that oil markets will face over the next quarter. OPEC is forecasting a supply deficit of more than 3 million barrels a day. If OPEC is right, the result will be the biggest reduction in stocks since 2007.

Voluntary production cuts by OPEC members are removing an additional 1.3 million barrels from the oil supply every day. This shortfall is taking place against a backdrop of rising oil prices and at a time when US reserves are at their lowest.


pic 5-Sep-18-2023-02-51-45-0282-PM

Source: Bloomberg


Chart #6 — 

Top 10 credit quality among S&P 500 issuers


The table below highlights the top 10 companies in the S&P 500 index with exceptional credit ratings. Among them, Microsoft and Johnson & Johnson are the only two companies with an AAA rating, i.e. the highest credit rating.

pic 6-Sep-18-2023-02-53-07-8420-PM

Source: Genuine Impact


Chart #7 — 

Year-to-date performance of hedge funds by strategy to end August 2023

At the end of August, most hedge fund strategies had posted a positive performance over 2023. The best performers were long/short global equity funds (+9.98%).  Multi-strategy funds rose by 4.51%, while credit strategies gained 5.34%. The year was more complicated for CTA (-2.48%) and global macro (-0.81%) strategies.

pic 7-Sep-18-2023-02-54-17-3089-PM

Source: www.aurum.com


Disclaimer

This marketing document has been issued by Bank Syz Ltd. It is not intended for distribution to, publication, provision or use by individuals or legal entities that are citizens of or reside in a state, country or jurisdiction in which applicable laws and regulations prohibit its distribution, publication, provision or use. It is not directed to any person or entity to whom it would be illegal to send such marketing material. This document is intended for informational purposes only and should not be construed as an offer, solicitation or recommendation for the subscription, purchase, sale or safekeeping of any security or financial instrument or for the engagement in any other transaction, as the provision of any investment advice or service, or as a contractual document. Nothing in this document constitutes an investment, legal, tax or accounting advice or a representation that any investment or strategy is suitable or appropriate for an investor's particular and individual circumstances, nor does it constitute a personalized investment advice for any investor. This document reflects the information, opinions and comments of Bank Syz Ltd. as of the date of its publication, which are subject to change without notice. The opinions and comments of the authors in this document reflect their current views and may not coincide with those of other Syz Group entities or third parties, which may have reached different conclusions. The market valuations, terms and calculations contained herein are estimates only. The information provided comes from sources deemed reliable, but Bank Syz Ltd. does not guarantee its completeness, accuracy, reliability and actuality. Past performance gives no indication of nor guarantees current or future results. Bank Syz Ltd. accepts no liability for any loss arising from the use of this document.

Read More

Straight from the Desk

Syz the moment

Live feeds, charts, breaking stories, all day long.

Thinking out loud

Sign up for our weekly email highlighting the most popular posts.

Follow us

Thinking out loud

Investing with intelligence

Our latest research, commentary and market outlooks