Charles-Henry Monchau

Chief Investment Officer

Chart #1 — 

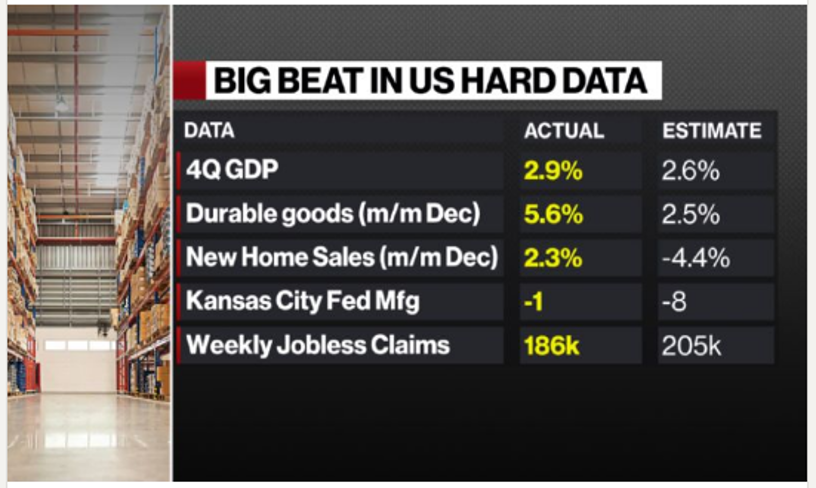
The U.S. economy’s resilience   

Macroeconomic figures released last week illustrate the resilience of the U.S. economy despite several quarters of rate hikes by the Fed. U.S. (real) GDP grew by 2.9% in Q4, a slight slowdown from the 3.2% annual growth rate in Q3. There were also gains in leading indicators, a further decline in unemployment insurance claims, and relatively encouraging new home sales figures.

U.S. data better than expected

Picture1-Jan-31-2023-10-29-03-9536-AMSource: CNBC


Chart #2 — 

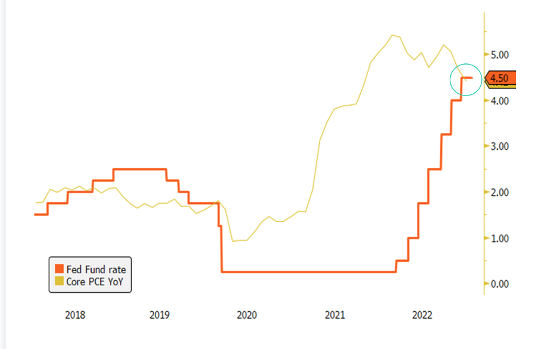
New evidence of falling inflation rate in the U.S. 


For the first time since February 2020, Fed funds rates are positive in real terms, with the Core PCE (Personal Consumption Expenditures) index coming in at 4.4% (versus the Fed funds rate of 4.5%). This bodes well for an upcoming pause in the Fed's rate hike, unless the U.S. economy surprises on the upside in the coming weeks.

PCE core index (yellow) versus Fed policy rates (red)

Picture2-Jan-31-2023-10-30-38-1799-AMSource: Bloomberg


Chart #3 — 

Eurozone business activity is back to expansionary territory

At the beginning of the year, the leading indicators of business activity in the eurozone (PMI indices) made a timid return into expansion territory after six successive months of decline. This slight improvement can be explained in particular by a much simpler than expected energy situation. In Germany, gas prices have collapsed to $54 per MWh, the lowest level since September 2021. Electricity is also cheaper than it has been in months. According to Jim Reid of Deutsche Bank, EU gas storage is now at its highest level for this time of year.

Gas prices in the eurozone (white) and one-year electricity prices in Germany (yellow)

Picture3-Jan-31-2023-10-32-10-3754-AMSource: Bloomberg, HolgerZ


Chart #4 — 

The come-back of the FAANGs

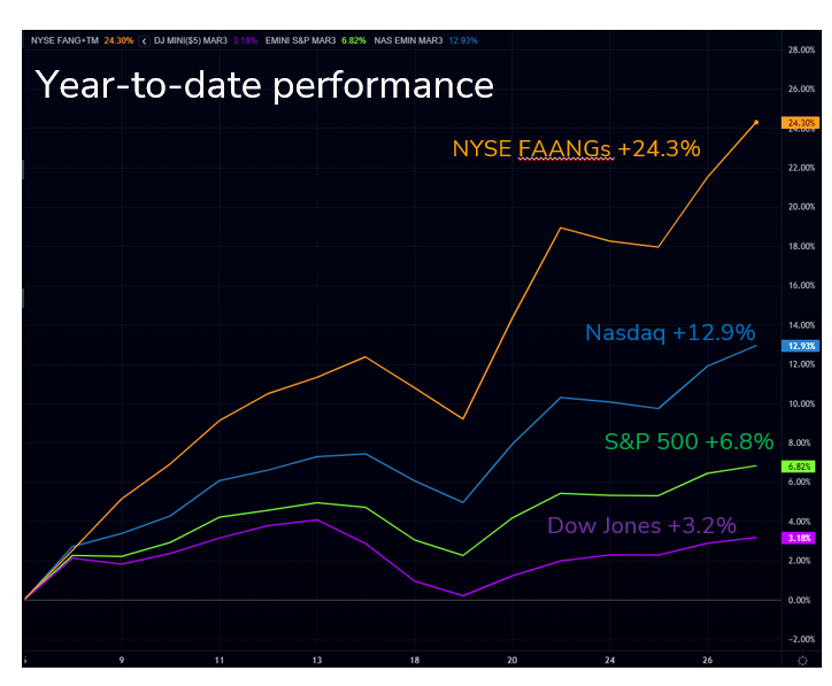
U.S. equities rallied last week as investor sentiment was boosted by the aforementioned macroeconomic (growth and inflation) figures. Year-to-date, the GAFA segment has been the best performer, with the Nasdaq outperforming both the S&P 500 and the Dow Jones. GAFAs had experienced sharp declines in Q4 2022 and now offer more attractive valuation levels.

Year-to-date performance of selected US equity indices

Picture4-Jan-31-2023-10-33-47-9528-AMSource: The Market Ear


Chart #5 — 

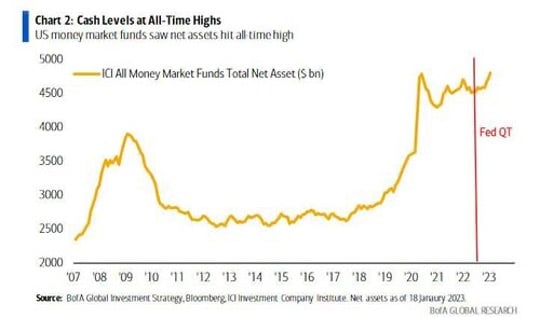
Cash levels remain very high

A massive build up of liquidity in U.S. money market funds could one day return to risky assets. Indeed, cash levels in money market assets have reached a record high of $4.8 billion. 

These high levels of investment in this type of investment are a result of the attractiveness of current interest rates but also reflect the level of caution of investors. 

Assets in U.S. money market funds reach all-time high

Picture5-3Source: Bank of America


Chart #6 — 

Equity markets recovery can be hectic

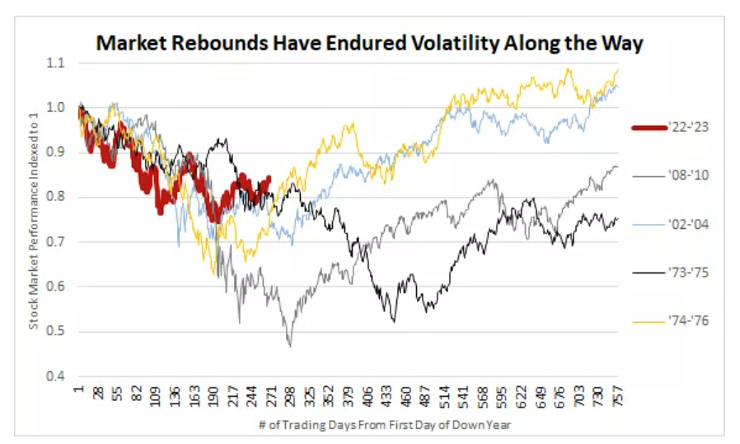
S&P 500 was down 19.4% in 2022 (excluding dividends). The good news is that years of negative returns are usually followed by good ones.

However, the market recovery that follows is rarely a straight line. As we can see in the chart below, we can expect a rather volatile way back up. 

Stock market performance of the S&P 500 in the years following a sharp decline (number of days since the beginning of the downward movement on the x-axis)

Picture6-2Source: Edward Jones


Chart #7 — 

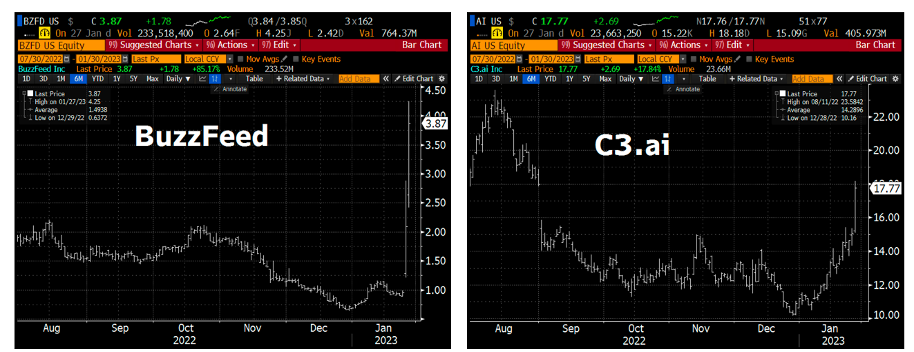
The buzz around AI-related stocks 

BuzzFeed’s stock jumped +290% in 2 days after announcing it would use ChatGPT to create content instead of the media company's editors. CEO Jonah Peretti said the publisher would use the technology to create more comprehensive quizzes and interactive content. 

Enterprise AI app platform C3.ai (AI) jumped 15% Friday after the White House and European Commission agreed to improve the use of AI in multiple areas.

BuzzFeed and C3.ai recorded strong advances last week

Picture7-2Source: Bloomberg, HolgerZ


Disclaimer

This marketing document has been issued by Bank Syz Ltd. It is not intended for distribution to, publication, provision or use by individuals or legal entities that are citizens of or reside in a state, country or jurisdiction in which applicable laws and regulations prohibit its distribution, publication, provision or use. It is not directed to any person or entity to whom it would be illegal to send such marketing material. This document is intended for informational purposes only and should not be construed as an offer, solicitation or recommendation for the subscription, purchase, sale or safekeeping of any security or financial instrument or for the engagement in any other transaction, as the provision of any investment advice or service, or as a contractual document. Nothing in this document constitutes an investment, legal, tax or accounting advice or a representation that any investment or strategy is suitable or appropriate for an investor's particular and individual circumstances, nor does it constitute a personalized investment advice for any investor. This document reflects the information, opinions and comments of Bank Syz Ltd. as of the date of its publication, which are subject to change without notice. The opinions and comments of the authors in this document reflect their current views and may not coincide with those of other Syz Group entities or third parties, which may have reached different conclusions. The market valuations, terms and calculations contained herein are estimates only. The information provided comes from sources deemed reliable, but Bank Syz Ltd. does not guarantee its completeness, accuracy, reliability and actuality. Past performance gives no indication of nor guarantees current or future results. Bank Syz Ltd. accepts no liability for any loss arising from the use of this document.
Read More

Straight from the Desk

Syz the moment

Live feeds, charts, breaking stories, all day long.

Thinking out loud

Sign up for our weekly email highlighting the most popular posts.

Follow us

Thinking out loud

Investing with intelligence

Our latest research, commentary and market outlooks