

.png)
Chart #1 —
S&P 500 closes above the 200-day moving average
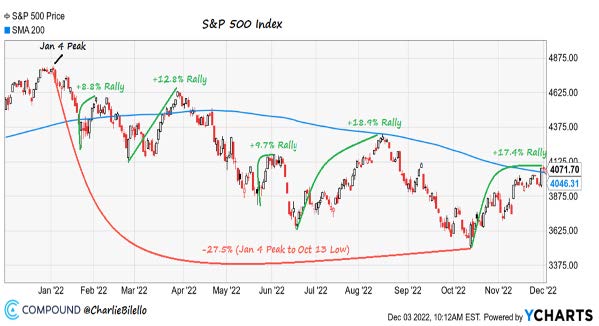
The S&P 500 index has gained 17.4% since its low point on October 13, marking the fifth bear market rally since the market peaked in early January. Last week, the index closed above its 200-day moving average for the first time in more than 7 months.
Looking at the 13 times (since 1950) that the S&P 500 has traded below this average for 6 months or more and closed above it, it has only once returned to new lows. One year later, the index was up 18.8% on average.
S&P 500 Index versus 200-day moving average
Source: Charlie Bilello
Chart #2 —
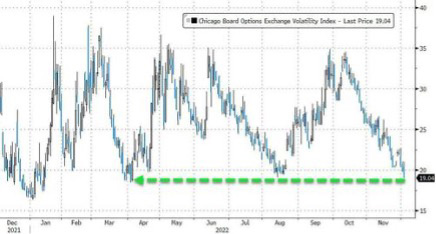
VIX falls back below 20
The S&P 500 VIX implied volatility index (or fear index) closed below 20 yesterday for the first time since August. The year has been marked by significant swings in the VIX, with brief periods of calm followed by a return to greater volatility. The VIX average for the year is around 26 (while the historical average is 19.7).
VIX Index
Source: Bloomberg, www.zerohedge.com
Chart #3 —
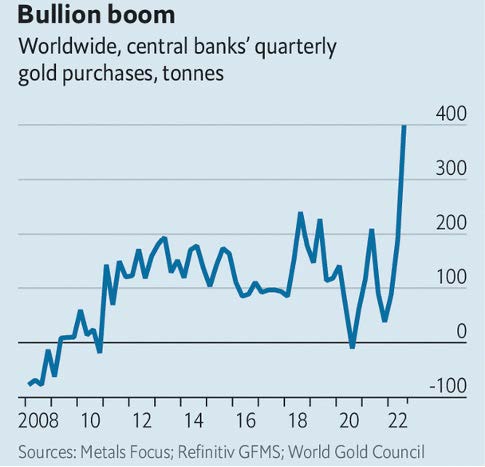
Central banks continue to accumulate gold
Gold rose back above $1,800 last week, its highest level since August. The weakening dollar and falling real yields have supported the yellow metal. As the Economist article points out, central banks around the world have been accumulating gold reserves this year at a rate not seen since 1967, when the US dollar was still backed by the precious metal. According to the World Gold Council, almost 400 tonnes were purchased by central banks, increasing their net long positions to 673 tonnes. Turkey was the largest buyer of gold during the quarter, followed by Uzbekistan
(26.13 tonnes) and India (17.46 tonnes). Though not all countries report their gold purchases on a regular basis, so it is difficult to know how much China and Russia bought during the same period.
Central bank gold purchases by quarter in tonnes
Source: The Economist
Chart #4 —
A better than expected US employment report
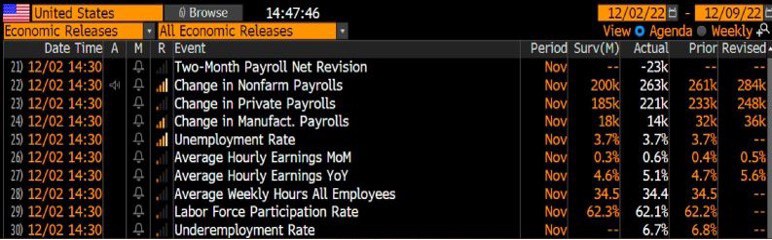
This was the most anticipated statistic of the week. The US employment figures turned out to be better than expected, which is not good news for the markets. Indeed, a deterioration in the job market is a necessary condition for the Fed to pause or reverse its interest rate hike.
In November, job creation rose by 263,000 against the 200,000 expected by the consensus. This is the 23rd consecutive monthly increase (the longest streak in history was 113 months of job growth from October 2010 to February 2020). Unemployment rate stands at 3.7% (as expected). Hourly earnings rose by 0.6% from the previous month (vs. +0.3% expected) and by 5.1% year-on-year (vs. +4.6%expected).
US unemployment statistics for November
Source: Bloomberg
Chart #5 —
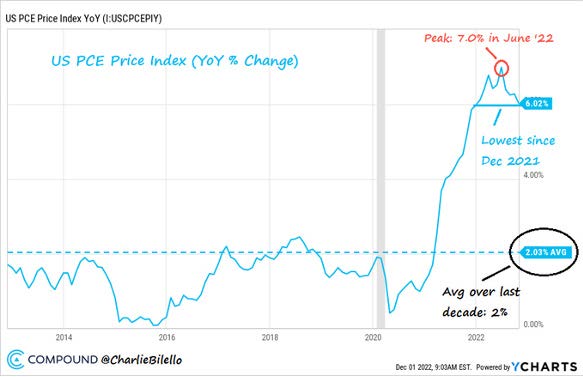
Peak inflation in the US seems to be behind us
The past week has provided further evidence that the rate of inflation in the US is slowing. Indeed, the PCE price index (the measure most closely followed by the Fed) fell to 6%, its lowest level since last December. The peak was 7% in June.
US PCE Price Index (YoY % Change)
Source: Charlie Bilello
Chart #6 —
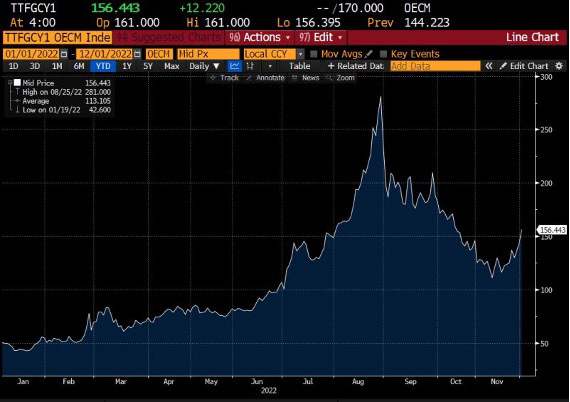
The come-back of the energy crisis in Europe?
As we can all feel it, temperatures have fallen across Europe and the one-year price of natural gas is up 40% from its mid-November low. This means that the Eurozone's trade balance is deteriorating again, even though the euro has recently appreciated. Will the euro soon resume its downward trend with the known consequences on imported inflation?
1-year natural gas futures contract
Source: Bloomberg
Chart #7 —
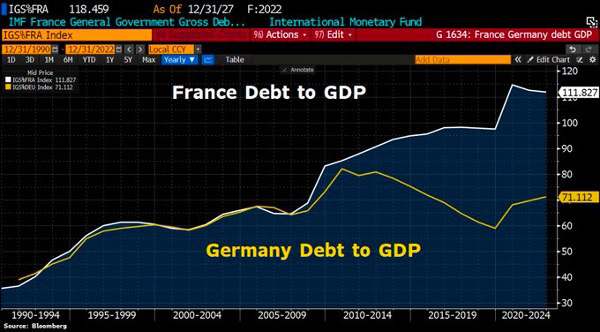
S&P downgrades France's outlook
France's credit outlook has been downgraded to “negative” by Standard & Poor's (S&P) as the slowdown in the domestic economy and the government's measures to protect households and businesses from rising energy costs weigh on public finances. The AA rating is confirmed but S&P has reduced the GDP forecast for 2023 from 1.7% to 0.2% and the public deficit forecast from 4% to 5.4% of GDP.
Debt/GDP ratio for France (white) and Germany (yellow)
Source: Bloomberg