.png)
Chart #1 —
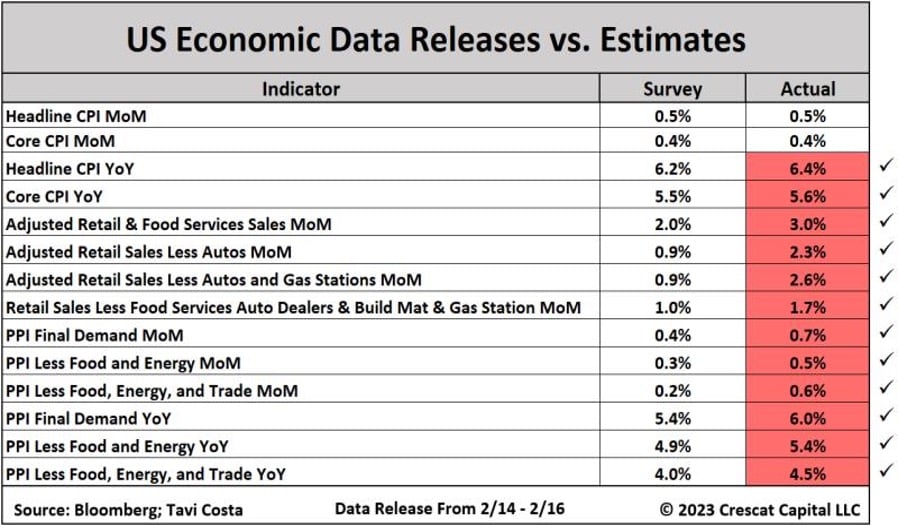
January US inflation data surprise on the upside
It was the most anticipated statistic of the week: the US inflation for the month of January. The year-on-year figure turned out to be higher than expected at +6.4% (versus +6.2% expected by the consensus) while the sequential increase was +0.5% (versus +0.4% expected).
Inflation excluding energy and food rose by 5.6% (vs. +5.5% expected) on a yearly basis and by 0.4% sequentially (vs. +0.3% expected).
While goods inflation (red line above) continues to decline (+1.4% vs. January 2022), services inflation (green line) continues to accelerate (+7.2% y/y), its highest level since July 1982. Housing had the largest contribution to the rate of price change with a 7.9% year-over-year increase.
Housing is a lagging indicator, and it will certainly take several months to reflect the strong slowdown currently observed in the US housing market.
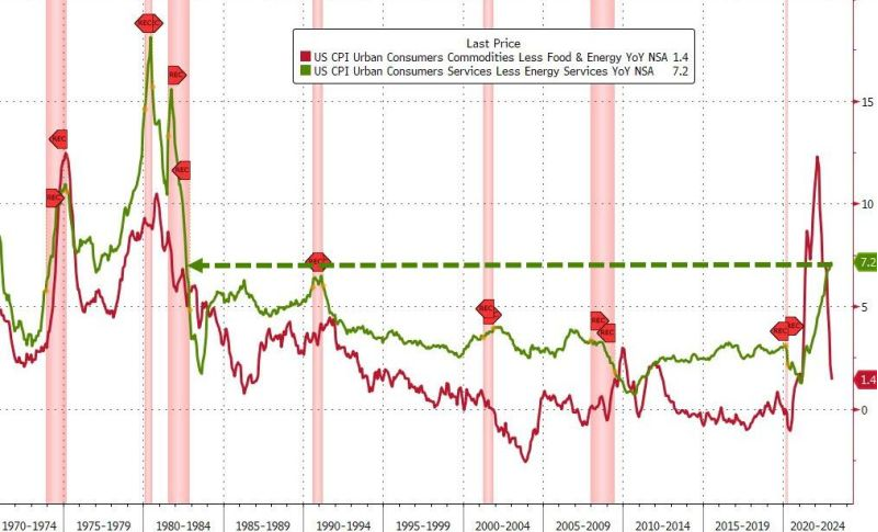
Source: www.zerohedge.com