
.png)
source: HolgerZ
We are sorry that for legal reasons we are not able to help US citizens or Canadian residents other than in Ontario, Quebec, or Alberta. Best wishes for the future…
We are sorry that for legal reasons we are not able to help US citizens or Canadian residents other than in Ontario, Quebec, or Alberta. Best wishes for the future…
You chose the following profile. If you made a mistake, please change here USA
This marketing document has been issued by Bank Syz Ltd. It is not intended for distribution to, publication, provision or use by individuals or legal entities that are citizens of or reside in a state, country or jurisdiction in which applicable laws and regulations prohibit its distribution, publication, provision or use. It is not directed to any person or entity to whom it would be illegal to send such marketing material.
This document is intended for informational purposes only and should not be construed as an offer, solicitation or recommendation for the subscription, purchase, sale or safekeeping of any security or financial instrument or for the engagement in any other transaction, as the provision of any investment advice or service, or as a contractual document. Nothing in this document constitutes an investment, legal, tax or accounting advice or a representation that any investment or strategy is suitable or appropriate for an investor's particular and individual circumstances, nor does it constitute a personalized investment advice for any investor.
This document reflects the information, opinions and comments of Bank Syz Ltd. as of the date of its publication, which are subject to change without notice. The opinions and comments of the authors in this document reflect their current views and may not coincide with those of other
Syz Group entities or third parties, which may have reached different conclusions. The market valuations, terms and calculations contained herein are estimates only. The information provided comes from sources deemed reliable, but Bank Syz Ltd. does not guarantee its completeness, accuracy, reliability and actuality. Past performance gives no indication of nor guarantees current or future results. Bank Syz Ltd. accepts no liability for any loss arising from the use of this document.

Charles-Henry Monchau
Chief Investment Officer
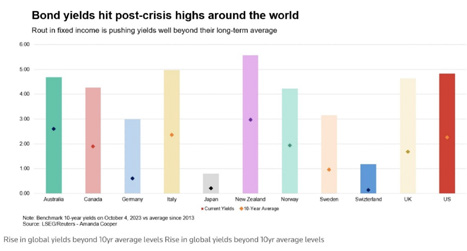
The chart below sums up the global bond market rout. Bond yields have reached (post-2008) record highs around the world: in the United States, 10-year US yields are flirting with 5%; German bund yields have reached 3%. They are now 1.15% in Switzerland. This rise in the cost of money has many consequences, such as higher mortgage yields as well as higher corporate and government financing costs (see chart #3).
source: HolgerZ
Incredible as it may seem, US Treasuries with very long durations (20 years and more) have now lost more, in terms of percentage decline, than US equities during the great financial crisis of 2007-2009. The decline (-58.3%) in the Vanguard Extended Duration Treasury ETF since its high (August 2020) now exceeds the losses (-56%) in the S&P 500 during the 2007 - 2009 stock market crash.
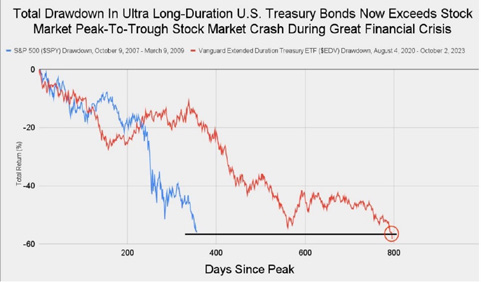
Source: Jack Farley
This is a new record. In a single day, US debt rose by $275 billion to an unprecedented $33.44 trillion. Two weeks earlier, US debt had passed the $33 trillion mark for the first time. This means that, on average, the US has accumulated $32 billion of debt every day over the last two weeks. If this pace continues, the US is on course to accumulate $1,000 billion in debt in the space of a month.
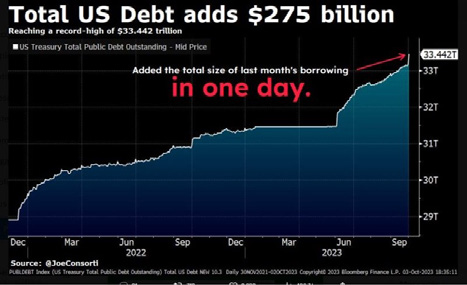
Source: Bloomberg
Washington is in turmoil after the US House of Representatives ousted Kevin McCarthy as Speaker, a first in the country's history. This political crisis comes at a time when the market is beginning to fear an imminent US debt crisis. Billionaire investor Ray Dalio is keeping a close eye on the risk associated with the US fiscal situation. "We're going to have a debt crisis in this country", he said earlier this week, adding to the volatility of US Treasury securities. Indeed, the cost of servicing the US debt is rising for the first time in 35 years. For almost 20 years, the cost of US debt fluctuated around 1.5%. Today, this cost has doubled to 3%. It will soon reach 5% as interest rates soar. To put that in perspective, 5% on $33 trillion is about $1.7 trillion a year in interest. As deficit spending rises, so do rates, as the US issues trillions in bonds to cover the budget deficit. It is partly this vicious circle that is driving up rates and leading to the situation where interest charges could soon represent 20% of US tax revenues.
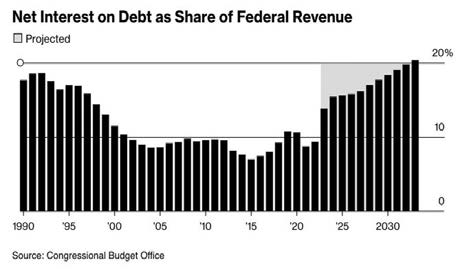
Source: CBO, Bloomberg
A Credit Default Swap (CDS) is a type of insurance under which financial institutions and investors protect themselves against the risk of defaulting on a loan by paying a premium. As the chart below shows, the premium paid on bonds issued by major US banks is rising steadily, a sign that the market is becoming increasingly nervous about the state of the US financial sector. Investment bank, Deutsche Bank, estimates that the rise in bond yields in Q3 could add $140 billion to banks' unrealised losses on the bonds they hold on their balance sheets. This means that the aggregate amount of these losses has reached a record $700 billion. Although the systemic risks to bank solvency are low, the fall in the value of these bonds held on their balance sheets could weigh on the capital adequacy ratios of financial institutions, potentially reducing their appetite for lending and slowing the flow of credit into the economy.
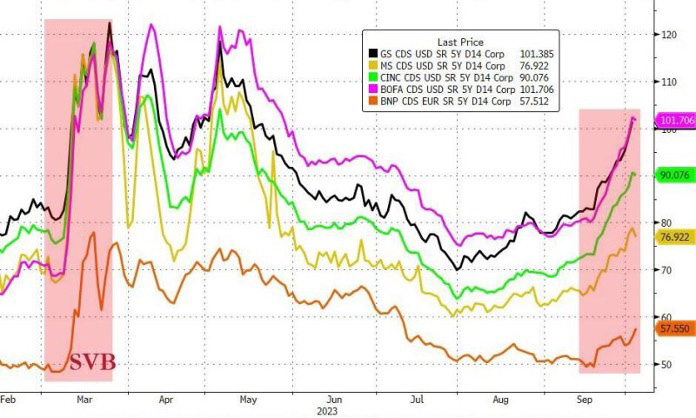
Source: Zerohedge.com, Bloomberg
Who would have thought? Over the last three years, the US money supply (M2) has risen by 14%, US inflation (CPI) has risen by 18% and the federal debt has risen by 24%. The world has had to deal with a pandemic and a war on Europe's doorstep. Over this period, the dollar index gained 19% while gold depreciated by 5%... We might have expected the stock markets to behave in diametrically opposed fashion. But this is clearly not the case...
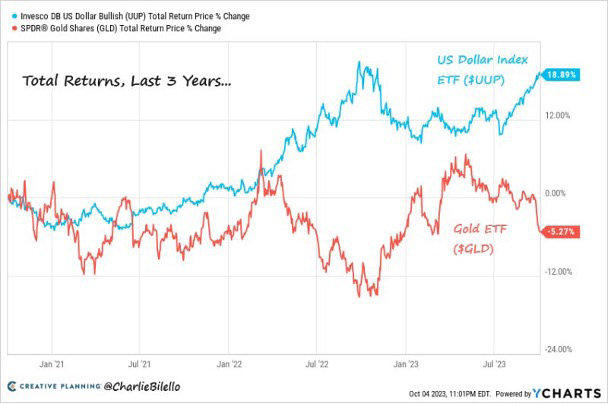
Source: Charlie Bilello
Under the impact of rising interest rates, the construction sector is literally collapsing in Germany. The German PMI construction index fell to 39.3 in September, from 41.5 in August (a value below 50 indicates a contraction in activity). This is the lowest level since statistics began.

Source: HolgerZ, Bloomberg
This marketing document has been issued by Bank Syz Ltd. It is not intended for distribution to, publication, provision or use by individuals or legal entities that are citizens of or reside in a state, country or jurisdiction in which applicable laws and regulations prohibit its distribution, publication, provision or use. It is not directed to any person or entity to whom it would be illegal to send such marketing material. This document is intended for informational purposes only and should not be construed as an offer, solicitation or recommendation for the subscription, purchase, sale or safekeeping of any security or financial instrument or for the engagement in any other transaction, as the provision of any investment advice or service, or as a contractual document. Nothing in this document constitutes an investment, legal, tax or accounting advice or a representation that any investment or strategy is suitable or appropriate for an investor's particular and individual circumstances, nor does it constitute a personalized investment advice for any investor. This document reflects the information, opinions and comments of Bank Syz Ltd. as of the date of its publication, which are subject to change without notice. The opinions and comments of the authors in this document reflect their current views and may not coincide with those of other Syz Group entities or third parties, which may have reached different conclusions. The market valuations, terms and calculations contained herein are estimates only. The information provided comes from sources deemed reliable, but Bank Syz Ltd. does not guarantee its completeness, accuracy, reliability and actuality. Past performance gives no indication of nor guarantees current or future results. Bank Syz Ltd. accepts no liability for any loss arising from the use of this document.
Meanwhile, Wall Street's long-term earnings expectations for the S&P 500 are now at record levels. Each week, the Syz investment team takes you through the last seven days in seven charts.
Meanwhile, corporate leadership is evolving rapidly: only 135 of the S&P 500 constituents from 1996 are still in the index today, while the EU goods trade deficit with China is close to a record €376bn. Each week, the Syz investment team takes you through the last seven days in seven charts.
Meanwhile, Trump’s personal crypto earnings in 2025 topped the combined profits of every publicly listed US crypto company. Each week, the Syz investment team takes you through the last seven days in seven charts.
Live feeds, charts, breaking stories, all day long.
Our latest research, commentary and market outlooks