
.png)
Source: Bespoke
We are sorry that for legal reasons we are not able to help US citizens or Canadian residents other than in Ontario, Quebec, or Alberta. Best wishes for the future…
We are sorry that for legal reasons we are not able to help US citizens or Canadian residents other than in Ontario, Quebec, or Alberta. Best wishes for the future…
You chose the following profile. If you made a mistake, please change here USA
This marketing document has been issued by Bank Syz Ltd. It is not intended for distribution to, publication, provision or use by individuals or legal entities that are citizens of or reside in a state, country or jurisdiction in which applicable laws and regulations prohibit its distribution, publication, provision or use. It is not directed to any person or entity to whom it would be illegal to send such marketing material.
This document is intended for informational purposes only and should not be construed as an offer, solicitation or recommendation for the subscription, purchase, sale or safekeeping of any security or financial instrument or for the engagement in any other transaction, as the provision of any investment advice or service, or as a contractual document. Nothing in this document constitutes an investment, legal, tax or accounting advice or a representation that any investment or strategy is suitable or appropriate for an investor's particular and individual circumstances, nor does it constitute a personalized investment advice for any investor.
This document reflects the information, opinions and comments of Bank Syz Ltd. as of the date of its publication, which are subject to change without notice. The opinions and comments of the authors in this document reflect their current views and may not coincide with those of other
Syz Group entities or third parties, which may have reached different conclusions. The market valuations, terms and calculations contained herein are estimates only. The information provided comes from sources deemed reliable, but Bank Syz Ltd. does not guarantee its completeness, accuracy, reliability and actuality. Past performance gives no indication of nor guarantees current or future results. Bank Syz Ltd. accepts no liability for any loss arising from the use of this document.

Charles-Henry Monchau
Chief Investment Officer
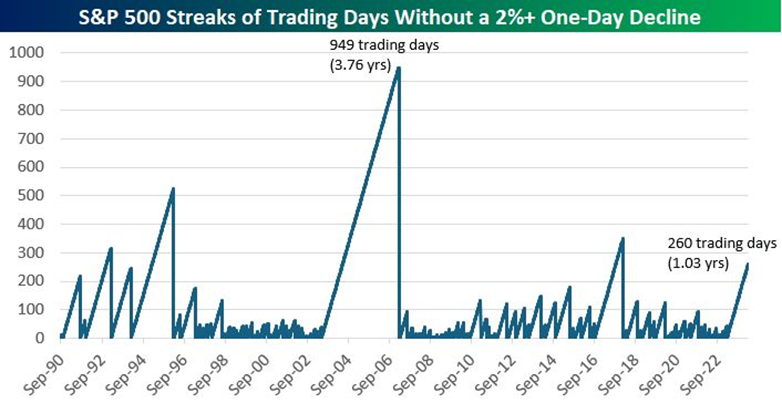
It's now been over a year since the S&P 500 dropped more than 2% in a single day. Looking at historical data since the 2000s, this is the third longest period without a major correction. However, the record number of days without a correction of more than 2% was observed between May 19, 2003, and February 26, 2007, when 949 working days (almost 4 years!) went by without a major daily correction...
Source: Bespoke
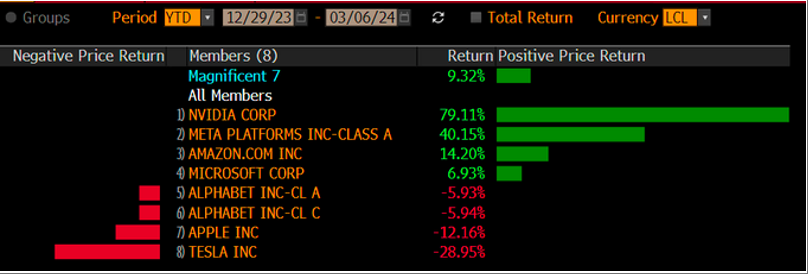
Last year, the Magnificent 7 (Alphabet, Amazon, Apple, Meta Platforms, Microsoft, Nvidia and Tesla) rose almost in unison, giving rise to the so-called "Mag 7" acronym. The start of 2024 seems to coincide with a change of regime for the Magnificent 7, as a wide dispersion of performance is observed: while Nvidia and Meta Platforms record spectacular progress, Tesla, Alphabet and Apple are in the red. The "Mag 7" is now being referred to as the "Mag 4"...
Source: Bloomberg
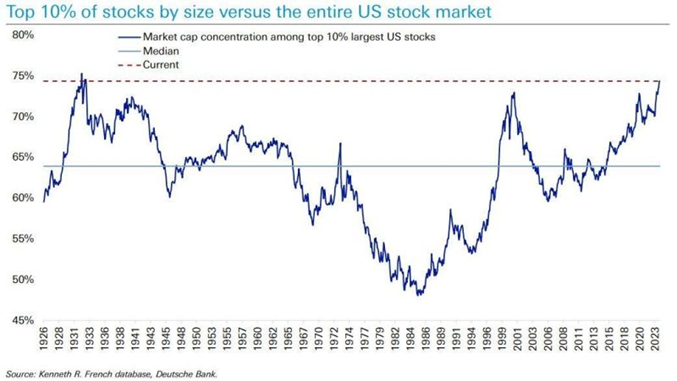
Fewer and fewer companies are listed on the stock market. In fact, the number of publicly traded companies in the USA has fallen by 50% since 1995. At present, there are only around 4,200 listed companies in the United States. The same trend has been observed for the number of banks in the U.S., which has fallen from 31,000 in 1920 to just 4,000 today.
What's more, the top 10% of U.S. stocks (by market capitalization) now account for around 75% of the total market. This is by far the most concentrated US stock market since the Great Depression of 1931. Even during the Internet bubble of 1998-2001, the concentration of the top 10% of stocks peaked at a lower level (around 72%) ... Big companies are getting bigger!
Source: DB, The Kobeissi Letter, Wall Street Engine
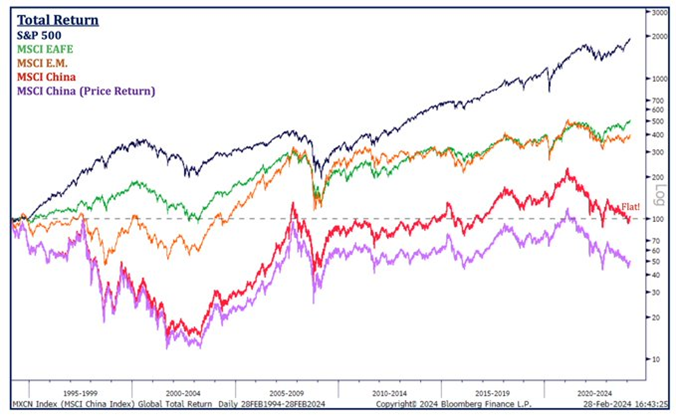
Goldman's CIO advises against investing in China, and the chart below probably explains the frustration with Chinese equities: over the past 30 years, the MSCI China index has returned 0% (price variation + dividends). Add to this mediocre performance the fact that this market has been highly volatile. Indeed, during this period, no fewer than 22 intra-annual corrections of more than -20% were observed (compared with 6 for the S&P 500). The average annual correction for the Chinese market was -30%, or 2x the average annual correction for the S&P 500.
Source: Strategas
The share of bonds issued by Japan held by the Japanese central bank (BOJ) has risen steadily over the past decade. This is an unusual behavior for a central bank of one of the world's largest economies.
Although the central bank is supposed to be an independent institution, the BoJ's monetary policy is effectively integrated into the Japanese government's fiscal policy.
The bank began buying massive quantities of bonds after the start of its monetary easing ("QE") policy in April 2013 under the leadership of Haruhiko Kuroda, a former senior official at the Ministry of Finance, who had then taken the helm of the BOJ with the support of then Prime Minister Abe.
Outstanding bonds held by the BOJ have continued to rise since it maintained its policy of monetary easing, even as its foreign counterparts began raising interest rates in 2022 to fight inflation.
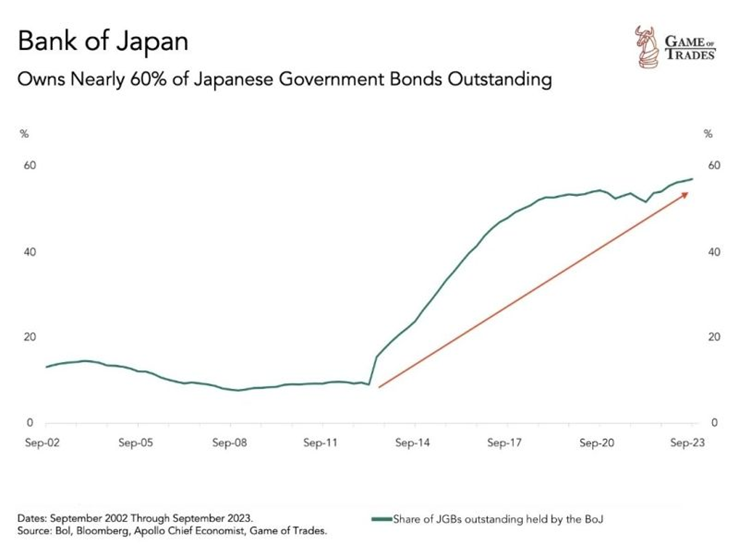
Source : Game of Trades
Since the great financial crisis of 2008, France has only managed to keep its budget deficit below 3% (one of the Maastricht Treaty criteria) once (in 2018). This track record is even worse than that of Italy. France's debt-to-GDP ratio is 110%, compared with 64% before the financial crisis. With potential GDP growth at barely 1% and declining, structurally low (or even negative) real interest rates are needed to support the government's debt burden.
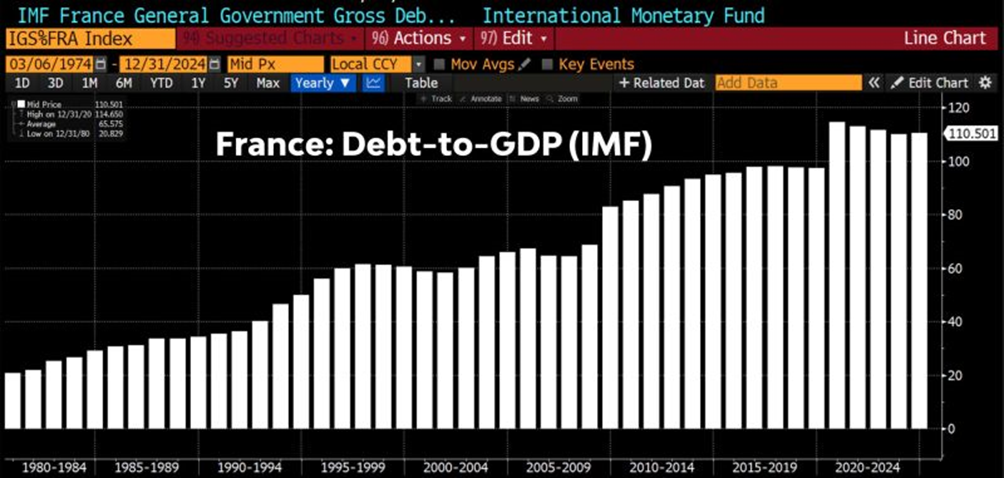
Source: Bloomberg
Tuesday's session was a historic one: not only did "digital gold" (aka bitcoin) hit an all-time high, but actual gold also traded at record levels. What is the message here for the fiat-currency-based financial system?
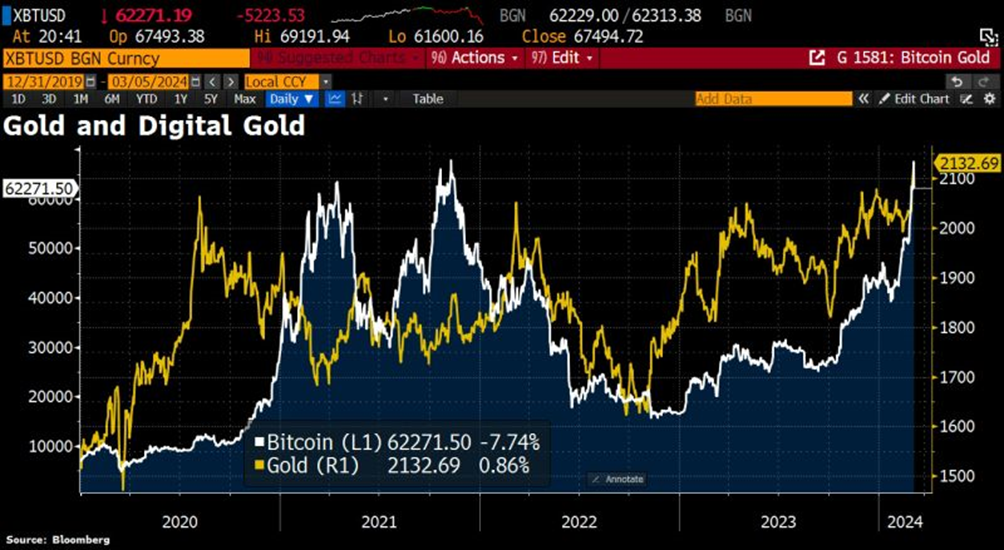
Source: HolgerZ, Bloomberg
This marketing document has been issued by Bank Syz Ltd. It is not intended for distribution to, publication, provision or use by individuals or legal entities that are citizens of or reside in a state, country or jurisdiction in which applicable laws and regulations prohibit its distribution, publication, provision or use. It is not directed to any person or entity to whom it would be illegal to send such marketing material. This document is intended for informational purposes only and should not be construed as an offer, solicitation or recommendation for the subscription, purchase, sale or safekeeping of any security or financial instrument or for the engagement in any other transaction, as the provision of any investment advice or service, or as a contractual document. Nothing in this document constitutes an investment, legal, tax or accounting advice or a representation that any investment or strategy is suitable or appropriate for an investor's particular and individual circumstances, nor does it constitute a personalized investment advice for any investor. This document reflects the information, opinions and comments of Bank Syz Ltd. as of the date of its publication, which are subject to change without notice. The opinions and comments of the authors in this document reflect their current views and may not coincide with those of other Syz Group entities or third parties, which may have reached different conclusions. The market valuations, terms and calculations contained herein are estimates only. The information provided comes from sources deemed reliable, but Bank Syz Ltd. does not guarantee its completeness, accuracy, reliability and actuality. Past performance gives no indication of nor guarantees current or future results. Bank Syz Ltd. accepts no liability for any loss arising from the use of this document.
Meanwhile, Wall Street's long-term earnings expectations for the S&P 500 are now at record levels. Each week, the Syz investment team takes you through the last seven days in seven charts.
Meanwhile, corporate leadership is evolving rapidly: only 135 of the S&P 500 constituents from 1996 are still in the index today, while the EU goods trade deficit with China is close to a record €376bn. Each week, the Syz investment team takes you through the last seven days in seven charts.
Meanwhile, Trump’s personal crypto earnings in 2025 topped the combined profits of every publicly listed US crypto company. Each week, the Syz investment team takes you through the last seven days in seven charts.
Live feeds, charts, breaking stories, all day long.
Our latest research, commentary and market outlooks