
.png)
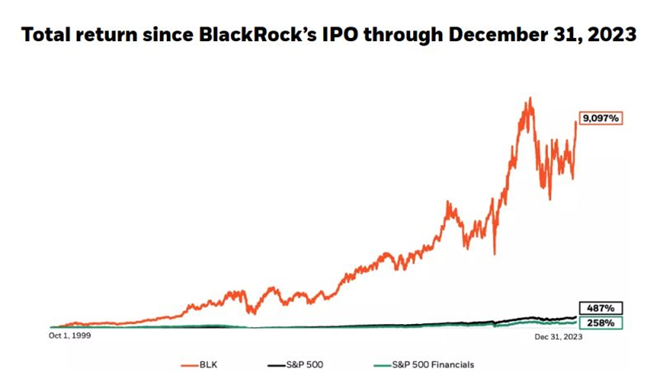
Source: Blackrock, S&P Global
We are sorry that for legal reasons we are not able to help US citizens or Canadian residents other than in Ontario, Quebec, or Alberta. Best wishes for the future…
We are sorry that for legal reasons we are not able to help US citizens or Canadian residents other than in Ontario, Quebec, or Alberta. Best wishes for the future…
You chose the following profile. If you made a mistake, please change here USA
This marketing document has been issued by Bank Syz Ltd. It is not intended for distribution to, publication, provision or use by individuals or legal entities that are citizens of or reside in a state, country or jurisdiction in which applicable laws and regulations prohibit its distribution, publication, provision or use. It is not directed to any person or entity to whom it would be illegal to send such marketing material.
This document is intended for informational purposes only and should not be construed as an offer, solicitation or recommendation for the subscription, purchase, sale or safekeeping of any security or financial instrument or for the engagement in any other transaction, as the provision of any investment advice or service, or as a contractual document. Nothing in this document constitutes an investment, legal, tax or accounting advice or a representation that any investment or strategy is suitable or appropriate for an investor's particular and individual circumstances, nor does it constitute a personalized investment advice for any investor.
This document reflects the information, opinions and comments of Bank Syz Ltd. as of the date of its publication, which are subject to change without notice. The opinions and comments of the authors in this document reflect their current views and may not coincide with those of other
Syz Group entities or third parties, which may have reached different conclusions. The market valuations, terms and calculations contained herein are estimates only. The information provided comes from sources deemed reliable, but Bank Syz Ltd. does not guarantee its completeness, accuracy, reliability and actuality. Past performance gives no indication of nor guarantees current or future results. Bank Syz Ltd. accepts no liability for any loss arising from the use of this document.

Charles-Henry Monchau
Chief Investment Officer
Source: Blackrock, S&P Global
Fiscal dominance is a situation in which monetary policy is dependent on fiscal policy, the former conforming to the necessities imposed by the latter.
The U.S. Treasury is issuing more Treasury bonds, and at a rate that is accelerating. In a regime of fiscal dominance, the central bank is obliged to lower rates to help finance public deficits. And with the Congress Budget Office (CBO) forecasting US budget deficits in the 5-7% range for the next two decades, the only real option for the US is to lower interest rates on government bonds, as the government continues to borrow in the short term.
Against this backdrop, investors tend to seek refuge in so-called stores of value, such as precious metals (gold, silver) and digital gold (bitcoin). Indeed, lowering interest rates simply to support government borrowing should lead to a depreciation of the dollar and higher inflation over time. Stores of value should therefore appreciate against the dollar.
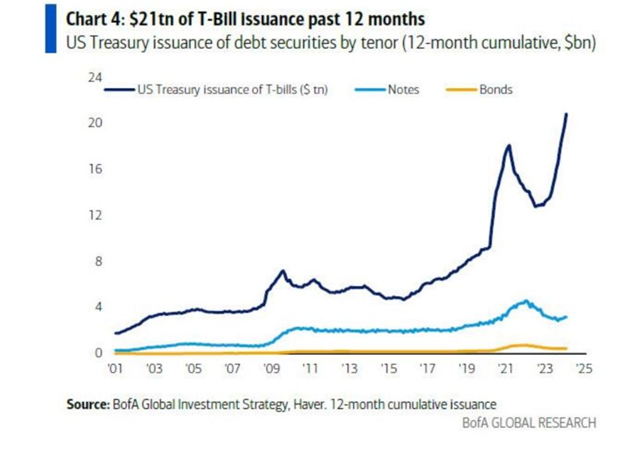
Source: LukeGromen, GraphFinancials, BofA, Craig Shapiro
We are witnessing a simultaneous increase in gold prices and a decrease in bond yields. A similar scenario occurred in the 1970s, when gold and 10-year government bond prices diverged sharply. Gold is currently at all-time highs, while long-dated bonds continue to weaken. This, combined with rising commodity prices (particularly oil), could prove trouble for the Fed and the banks.
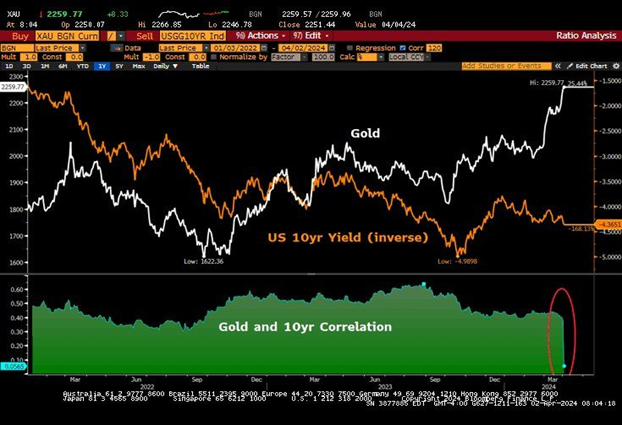
Source: Bloomberg
Despite the rebalancing of NASDAQ 100 stock weights in mid-2023, the combined weight of Microsoft, Apple, Nvidia, Amazon, Alphabet and META still constitutes a substantial percentage of the index (38%).
Without this rare adjustment, the second of its kind in the last 25 years, these companies would currently represent 58% of the index.
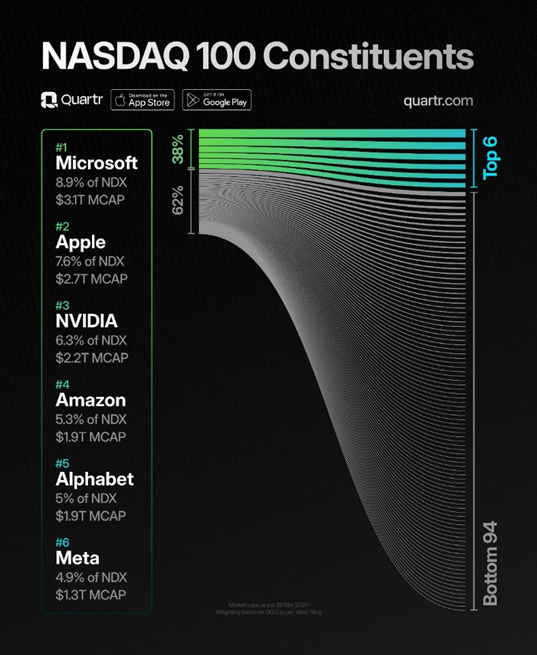
Source: Quartr
Tesla delivered around 9% fewer vehicles in the first quarter of this year than in the previous year. This is the first time its quarterly sales have fallen since the 2020 pandemic-induced downturn.
Even so, the company delivered some 387,000 cars, enabling it to regain the title of "world's largest producer of electric vehicles", which it had previously lost to Chinese battery manufacturer BYD, now a carmaker, which recorded an even more spectacular drop in deliveries (-42%).
These figures sent Tesla's share price down by 5% on Wednesday, worsening the company's difficult start to the year. Indeed, the Elon Musk-led company posted the worst first-quarter performance of any S&P 500 stock.
Having pioneered the industry for so long, Tesla is now facing increased competition. It must rely on its aging ranges (Model Y and Model 3) to maintain sales momentum - while battling factory fires, shipping delays and labour disputes in Nordic countries. To revive demand, the company turned to (numerous) price reductions and even resorted to advertising for the first time, after years of resistance.
Ultimately, Tesla and BYD are fighting gravity as the market for all-electric vehicles weakens. Indeed, a recent YouGov poll suggests that the problem may run deeper, with Americans increasingly sceptical about the real environmental impact of going electric, while common concerns about range (especially in cold weather) and cost have not gone away.
Ironically, sales of hybrid vehicles (+65% by 2023) are growing faster than those of all-electric vehicles (+46%). Toyota, for example, has reported an upsurge in sales of its iconic hybrid series, the Prius.

Source : Chartr
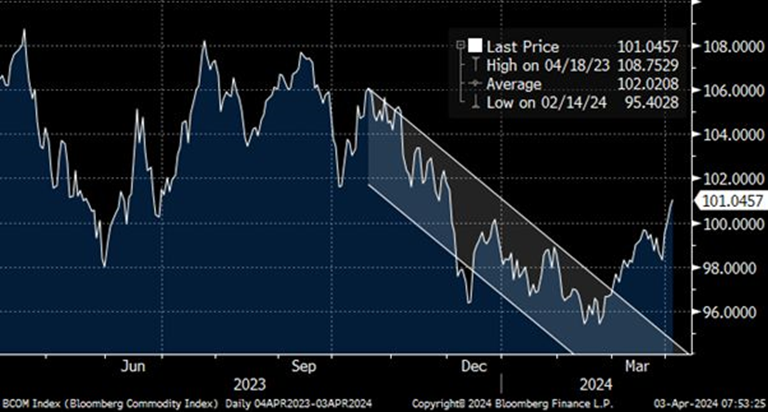
The Bloomberg Commodities index recently broke through significant resistance. Crude oil, copper, gold, silver, etc. are all up, indicating broad participation in the upside. Remarkably, neither gold, copper nor oil seem particularly affected by high interest rates or dollar strength. Gold speculators now have net long positions, but their aggregate exposure remains well below the extremes that marked the highs of mid-2016 or mid-2020. Copper’s strength has been confirmed with big breakouts among the related equities.
Source: Bloomberg
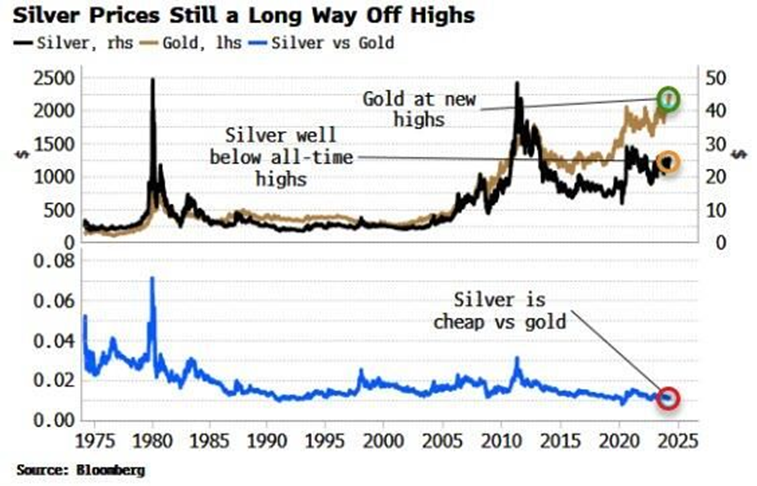
Despite the recent price surge, silver remains relatively inexpensive compared to gold. On the other hand, the price of silver is a long way from its previous all-time highs.
While silver's previous rebounds have subsequently disappointed investors, the current context seems different. Industrial demand is on the rise, and so is investor interest... Could silver catch up with gold in terms of market performance?
Source: Bloomberg, Markets & Mayhem
This marketing document has been issued by Bank Syz Ltd. It is not intended for distribution to, publication, provision or use by individuals or legal entities that are citizens of or reside in a state, country or jurisdiction in which applicable laws and regulations prohibit its distribution, publication, provision or use. It is not directed to any person or entity to whom it would be illegal to send such marketing material. This document is intended for informational purposes only and should not be construed as an offer, solicitation or recommendation for the subscription, purchase, sale or safekeeping of any security or financial instrument or for the engagement in any other transaction, as the provision of any investment advice or service, or as a contractual document. Nothing in this document constitutes an investment, legal, tax or accounting advice or a representation that any investment or strategy is suitable or appropriate for an investor's particular and individual circumstances, nor does it constitute a personalized investment advice for any investor. This document reflects the information, opinions and comments of Bank Syz Ltd. as of the date of its publication, which are subject to change without notice. The opinions and comments of the authors in this document reflect their current views and may not coincide with those of other Syz Group entities or third parties, which may have reached different conclusions. The market valuations, terms and calculations contained herein are estimates only. The information provided comes from sources deemed reliable, but Bank Syz Ltd. does not guarantee its completeness, accuracy, reliability and actuality. Past performance gives no indication of nor guarantees current or future results. Bank Syz Ltd. accepts no liability for any loss arising from the use of this document.
Meanwhile, Wall Street's long-term earnings expectations for the S&P 500 are now at record levels. Each week, the Syz investment team takes you through the last seven days in seven charts.
Meanwhile, corporate leadership is evolving rapidly: only 135 of the S&P 500 constituents from 1996 are still in the index today, while the EU goods trade deficit with China is close to a record €376bn. Each week, the Syz investment team takes you through the last seven days in seven charts.
Meanwhile, Trump’s personal crypto earnings in 2025 topped the combined profits of every publicly listed US crypto company. Each week, the Syz investment team takes you through the last seven days in seven charts.
Live feeds, charts, breaking stories, all day long.
Our latest research, commentary and market outlooks