
.png)
Source: Bloomberg
We are sorry that for legal reasons we are not able to help US citizens or Canadian residents other than in Ontario, Quebec, or Alberta. Best wishes for the future…
We are sorry that for legal reasons we are not able to help US citizens or Canadian residents other than in Ontario, Quebec, or Alberta. Best wishes for the future…
You chose the following profile. If you made a mistake, please change here USA
This marketing document has been issued by Bank Syz Ltd. It is not intended for distribution to, publication, provision or use by individuals or legal entities that are citizens of or reside in a state, country or jurisdiction in which applicable laws and regulations prohibit its distribution, publication, provision or use. It is not directed to any person or entity to whom it would be illegal to send such marketing material.
This document is intended for informational purposes only and should not be construed as an offer, solicitation or recommendation for the subscription, purchase, sale or safekeeping of any security or financial instrument or for the engagement in any other transaction, as the provision of any investment advice or service, or as a contractual document. Nothing in this document constitutes an investment, legal, tax or accounting advice or a representation that any investment or strategy is suitable or appropriate for an investor's particular and individual circumstances, nor does it constitute a personalized investment advice for any investor.
This document reflects the information, opinions and comments of Bank Syz Ltd. as of the date of its publication, which are subject to change without notice. The opinions and comments of the authors in this document reflect their current views and may not coincide with those of other
Syz Group entities or third parties, which may have reached different conclusions. The market valuations, terms and calculations contained herein are estimates only. The information provided comes from sources deemed reliable, but Bank Syz Ltd. does not guarantee its completeness, accuracy, reliability and actuality. Past performance gives no indication of nor guarantees current or future results. Bank Syz Ltd. accepts no liability for any loss arising from the use of this document.
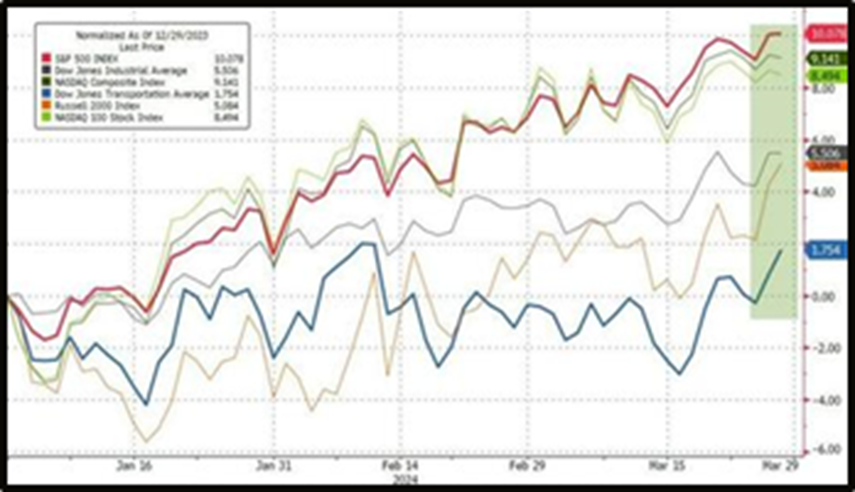
The S&P500 has closed the first quarter off with a notable 10.2% gain. This represents the best start to a year for the index since 2019, outperforming the Nasdaq and other main US indices. Despite the S&P500’s slight outperformance over the Nasdaq, both indices have been hitting new all-time highs, with the S&P500 breaking through 5,200 pts and the Nasdaq crossing above its previous 2021 high of 16,057 pts.
Source: Bloomberg
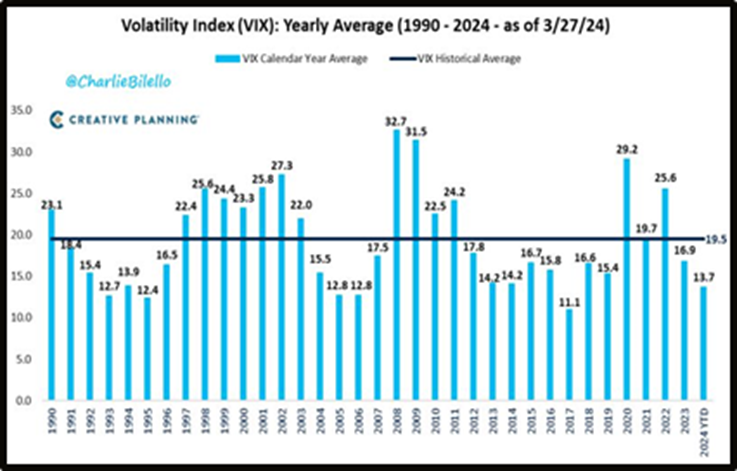
The $VIX has averaged 13.7 thus far in 2024, a figure noticeably below its historical average of 19.5. These volatility levels are setting the scene for 2024 to have the lowest volatility since 2017. Greed on the other hand has been heating up, with the Fear & Greed index shifting between “Greed” and “Extreme Greed” during Q1. This sentiment is also expressed by the number of US households allocated into equities, which is now at record highs, above 48%.
Source: Charlie Bilello
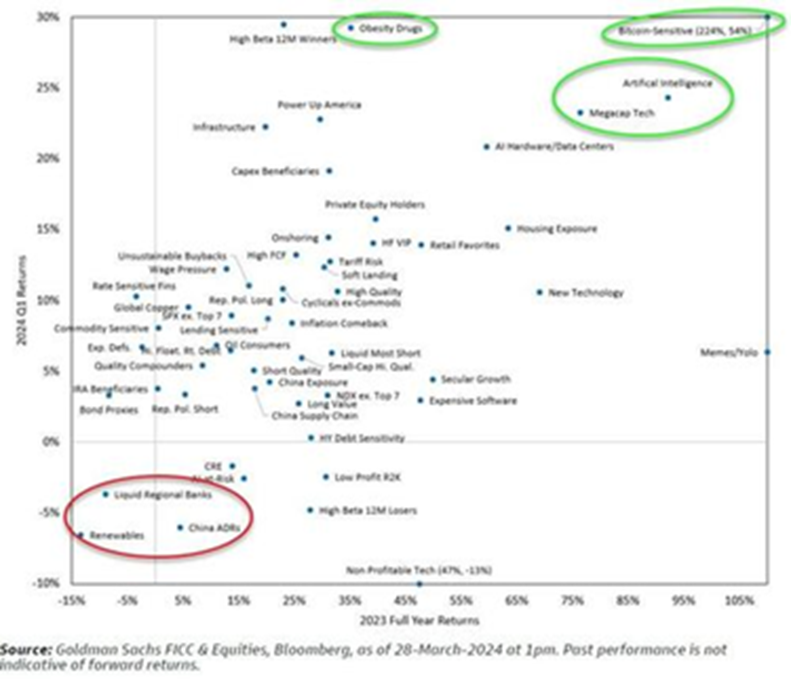
The first quarter of the year has seen themes from 2023 repeat themselves with the biggest winners among US equities being: Bitcoin-Sensitive, Artificial-Intelligence, Megacap Tech, and Obesity Drugs. Among the biggest losers have been: Liquid Regional Banks, Renewables, and China ADRs.
Source: Goldman Sachs
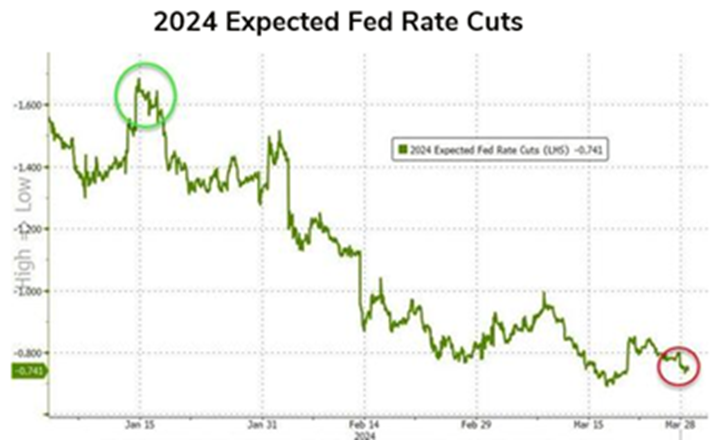
Market expectations of Fed rate cuts have dramatically decreased during Q1. The strong “hard” data together with sticky inflation have driven 2024 rate cut expectations from almost 7 cuts, to now less than 3. However, the strength in equities and credit has overshadowed any rise in yields and pushed financial conditions to their lowest level since prior to the Fed’s rate-hiking cycle. This decline is equivalent to about 100bps of rate cuts which gives the Fed breathing room to cut rates, but also creates uncertainty regarding if financial conditions are now becoming too easy to tame inflation.
Source: www.zerohedge.com, Bloomberg
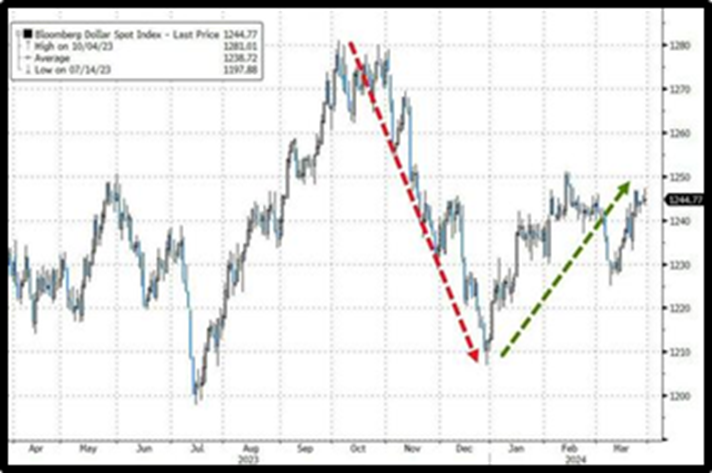
The dollar rallied in Q1, regaining around half of the ground lost during Q4. The USD was supported by yen weakness as the Japanese currency has plunged to its weakest since 1990. The scenario of higher interest rates for longer in the U.S. is also likely providing the dollar with a boost.
Source: Bloomberg
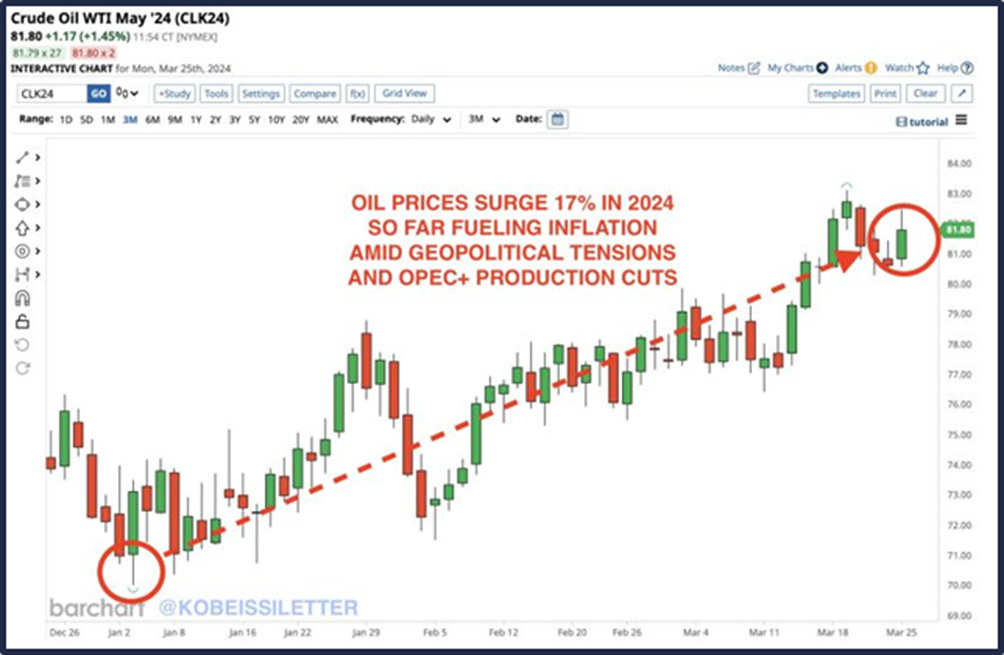
Oil prices are now up over 17% this year, with crude sitting well above $80/barrel again. The OPEC remains committed to production cuts and geopolitical tensions continue to threaten supply. Saudi Arabia leads the pack of production cuts, having recently extended its previously implemented cut of 1 million barrels per day, all through Q2 of 2024. Meanwhile, global demand forecasts are being raised and inflation appears to be rebounding. Even with non-OPEC production at record highs, oil prices continue to skyrocket.
Source: The Kobeissi Letter
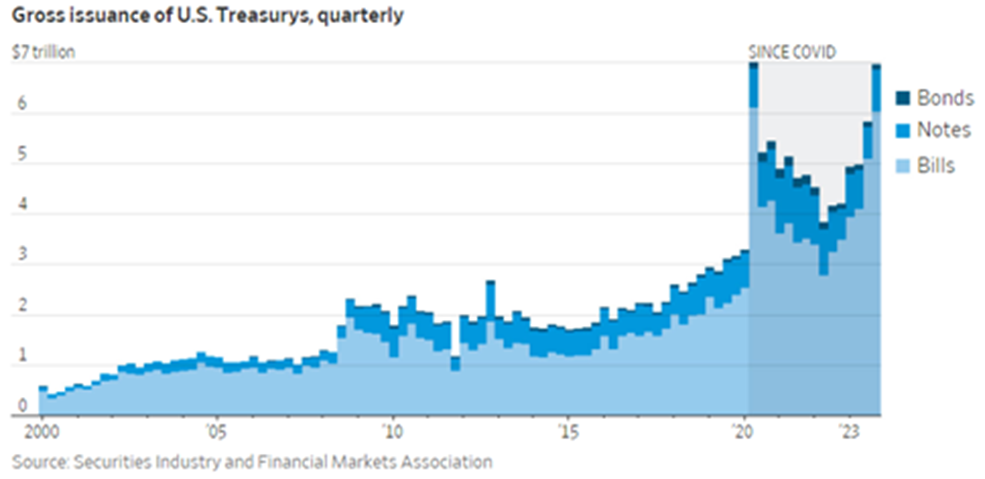
Increasingly more key figures in finance are sounding the alarm on the snowballing US national debt, which now sits at around $34tn. BlackRock’s CEO, Larry Fink, has been cautioning that there is no guarantee investors will continue to purchase U.S. Treasuries, and was quoted as saying: “The situation is more urgent than I can ever remember”. The issuance of US Treasurys has been accelerating over recent years, sending the size of the U.S. government bond market to a record $27tn. This figure represents an approx. 70% increase from levels at the end of 2019, and is nearly 6x larger than prior to the 08-09 GFC. A key development in this story will take place with the US elections in November, as an expensive fiscal package, rolled out by the new administration, could lead to a fiscal crisis as early as 2025, according to Wharton’s Professor Gomes.
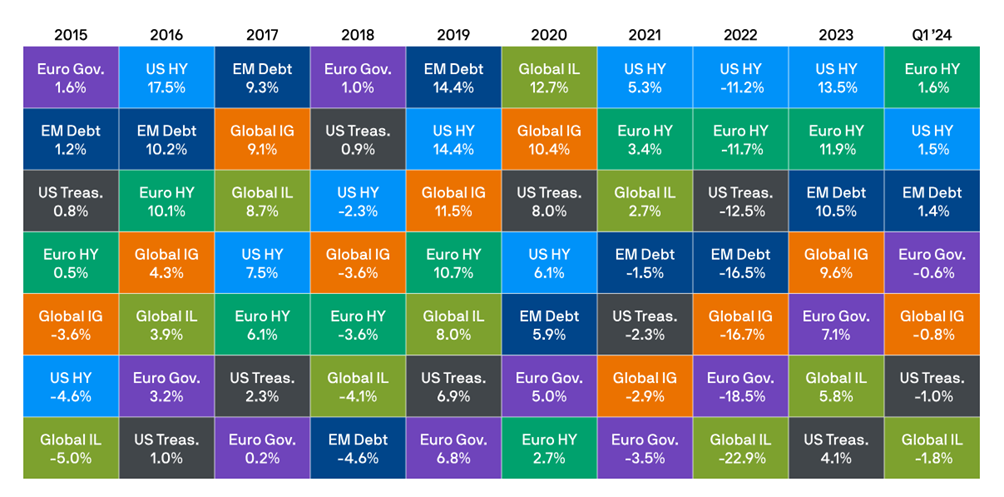
US treasuries have been dumped during Q1 as inflation numbers have been stronger than anticipated, and investors’ expectations for FED rate cuts over 2024 have been decreasing. US High Yield Credit Spreads have moved down to 3.05%, representing their tightest level since January 2022. Similarly, US Investment Grade Credit Spreads have moved down to 0.91%, their tightest level since November 2021. Note that Fixed Income (based on the Global Aggregate index) is the worst performing asset class so far in 2024 (-2.1%).
Source: JP Morgan
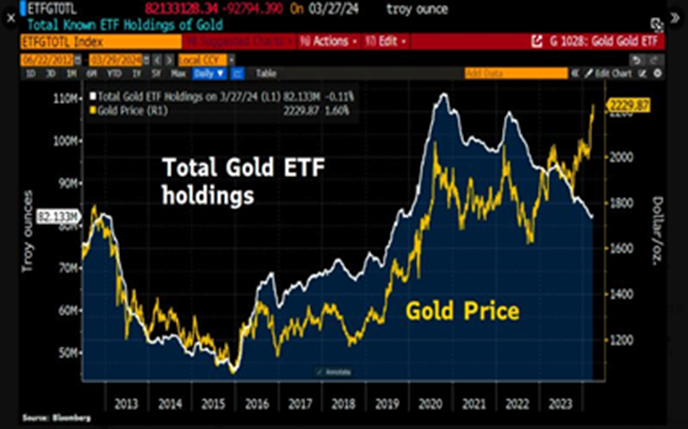
Gold has hit a new all-time high, reaching prices above $2,220/oz, even as funds continue to flow out of gold ETFs. As predictions of interest-rate cuts continue to moderate, gold ETFs recorded their 9th consecutive month of outflows in February. Central Banks around the world have continued their gold shopping spree, with China’s PBOC leading the charge, adding over 12 tonnes to their reserves in February. Gold prices saw a remarkable rise of 9.1% during March 2024, marking its best monthly performance since July 2020. Additionally, gold has been outperforming the S&P500 since February.
Source: Bloomberg
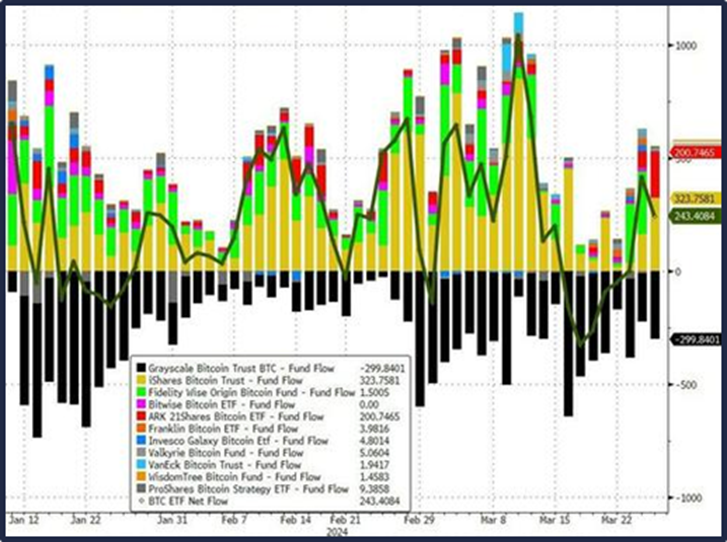
Q1 was dominated by bitcoin headlines, especially since the launch of the Bitcoin Spot ETF in mid-January. The success of the spot ETF has been second to none, with the BlackRock BTC ETF being the fastest ever to reach $10bn AUM. The massive inflows into these ETFs, coupled with the media attention generated around Bitcoin, have sent its prices to new all-time highs against the USD, even breaking $73,000 in mid-March. Strong catalysts and growing institutional demand have led to wild speculation surrounding price targets for the remainder of the year; either way, Bitcoin will likely continue to make headlines in the months to come.
Source: Bloomberg
This marketing document has been issued by Bank Syz Ltd. It is not intended for distribution to, publication, provision or use by individuals or legal entities that are citizens of or reside in a state, country or jurisdiction in which applicable laws and regulations prohibit its distribution, publication, provision or use. It is not directed to any person or entity to whom it would be illegal to send such marketing material. This document is intended for informational purposes only and should not be construed as an offer, solicitation or recommendation for the subscription, purchase, sale or safekeeping of any security or financial instrument or for the engagement in any other transaction, as the provision of any investment advice or service, or as a contractual document. Nothing in this document constitutes an investment, legal, tax or accounting advice or a representation that any investment or strategy is suitable or appropriate for an investor's particular and individual circumstances, nor does it constitute a personalized investment advice for any investor. This document reflects the information, opinions and comments of Bank Syz Ltd. as of the date of its publication, which are subject to change without notice. The opinions and comments of the authors in this document reflect their current views and may not coincide with those of other Syz Group entities or third parties, which may have reached different conclusions. The market valuations, terms and calculations contained herein are estimates only. The information provided comes from sources deemed reliable, but Bank Syz Ltd. does not guarantee its completeness, accuracy, reliability and actuality. Past performance gives no indication of nor guarantees current or future results. Bank Syz Ltd. accepts no liability for any loss arising from the use of this document.
The first quarter of 2025 has been a particularly turbulent one for the financial markets: US equities had their worst relative performance in 23 years, Chinese markets rebounded, gold reached new highs and economic and geopolitical uncertainties fuelled volatility. Here are 10 charts that highlight the first three months of the year.
Despite recession concerns, economic growth showed resilience, while equities retreated in October and inflation continued its slow decline. Nuclear energy was poised to power the future of AI, while the market suggested buying "Trump" and selling "Kamala” when referring to U.S. Election bets. Here are 10 charts to review what happened in the markets during October.
The Fed cuts rates, meanwhile Europe teeters on the brink of recession, China ramps up stimulus, and U.S. debt surges. Developed market equities surge amid global challenges, while fixed income rallies on easing rate expectations. Each quarter, the Syz investment team takes you through the last 3 months in 10 charts.
Live feeds, charts, breaking stories, all day long.
Our latest research, commentary and market outlooks