

.png)
Chart #1 — A never-ending 3rd quarter
Equities, bonds and most commodities recorded very strong losses in the third quarter. On the equity markets, the Eurostoxx 50 (-4.8%), the S&P 500 (-4.9%) and the Dow Jones (-6.4%) are all in the red. The Nikkei 225 (-2.1%) and the Nasdaq 100 (-4.1%) are holding up slightly better. The bond market continues to be highly correlated with the equity markets. The 10-year US Treasury bond fell by -5.7%. The vast majority of currencies show significant declines against the dollar. Commodities gave up a large part of their gains of the first half of the year: gold corrected by 7.7%, copper by -8.7% and oil by 24.6%. The biggest decline was in wood (-33.3%), which could be a bad omen for new home sales in the US. Assets in positive territory include natural gas (+25.9%), palladium (+13.2%), the VIX index (+9.6%) and the US dollar index (+7.3%).
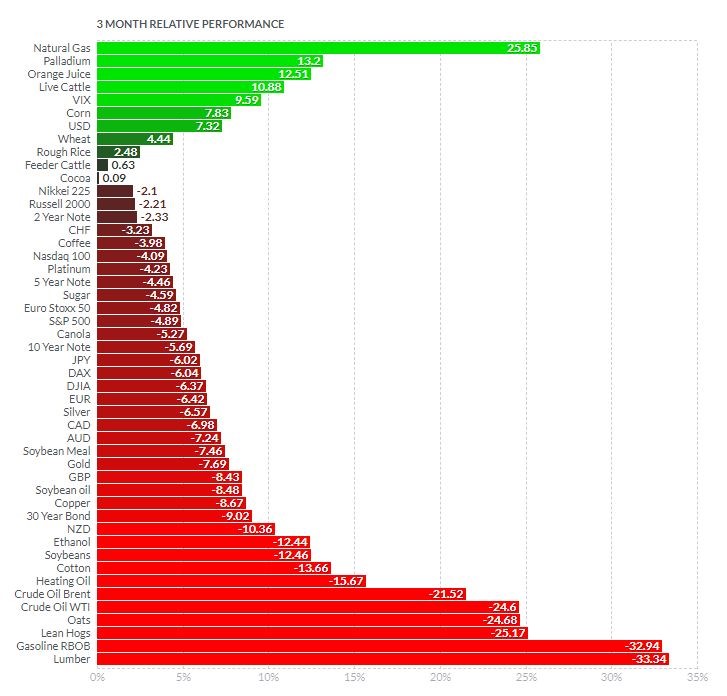
Chart #2 — The steep decline in US long-dated bonds
The global bond market is currently experiencing its worst decline on record. While the bond crash has spread across all global markets and issuer grades, it is the long end of the US Treasury yield curve that is showing the most dramatic decline since the 2020 highs (-37.3%).
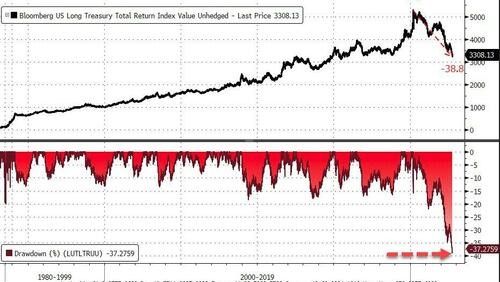
Chart #3 — Balanced portfolios down for a third consecutive quarter
A "balanced" equity/bond portfolio (US markets) recorded another significant decline in the third quarter. This is the third consecutive quarter of decline. Since the highs of 2021, the cumulative decline in the US equity and bond markets is $57.8 trillion. This is the largest wealth destruction on record.
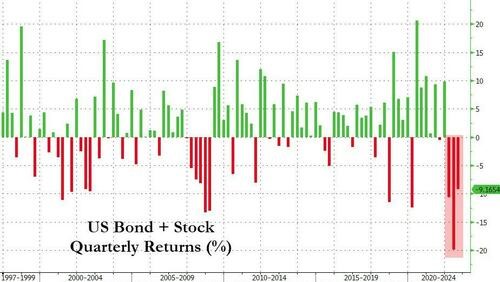
Chart #4 — A market turnaround in October?
October is historically the month when the downturn in the markets ends and begins. It is the month that starts the most buoyant period for risky assets, i.e. the last quarter.
The study of cycles shows that this positive seasonality is particularly marked in mid-term election years - which will be the case this year. But beware: this average is not statistically significant.
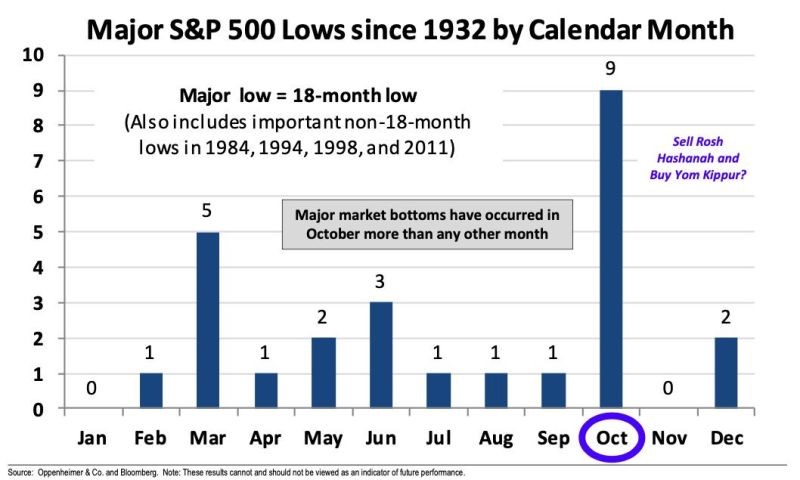
Chart #5 — A strong dollar or a weak Europe?
While the dollar index continues to appreciate, a detailed analysis shows a significant performance differential between two categories of countries: those in the G10 and emerging countries (excluding China and Russia). It can be seen that, contrary to other periods of crisis, emerging countries are far more resilient than developed countries.
This is due to the euro and the pound, which suggests that it is the European currencies that are weak, rather than the dollar that is strong.
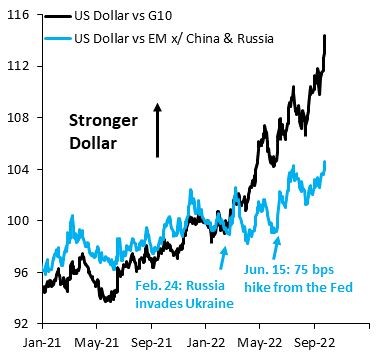
Chart #6 — A roller-coaster week for UK sovereign bonds
The UK is in the midst of a financial crisis of rare intensity. Last week, the pound hit an all-time low against the dollar, coming very close to parity, while sovereign bonds saw their yields reach their highest level since 2008. The scale of the crisis is such that members of the Bank of England worked through the night on Tuesday to save the UK's pension fund system. Indeed, the collapse of gilt bonds has led to huge margin calls on UK pension funds, triggering forced sales of gilts, further fuelling the decline. On Wednesday morning, the Bank of England had to announce the temporary suspension of the Quantitative Tightening and the implementation of a sovereign bond purchase programme in order to curb the rise in yields. Following this announcement, UK 30-year bond yields, which had previously reached a 20-year high (>5%), fell by 0.75% to 4.3%, the largest daily fall in yields on record.
Daily performance of UK 30-year sovereign bonds (in %)
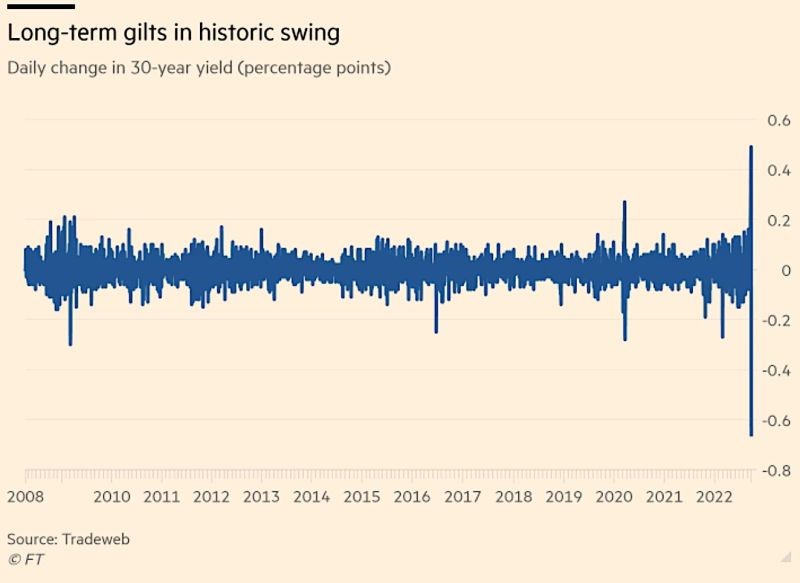
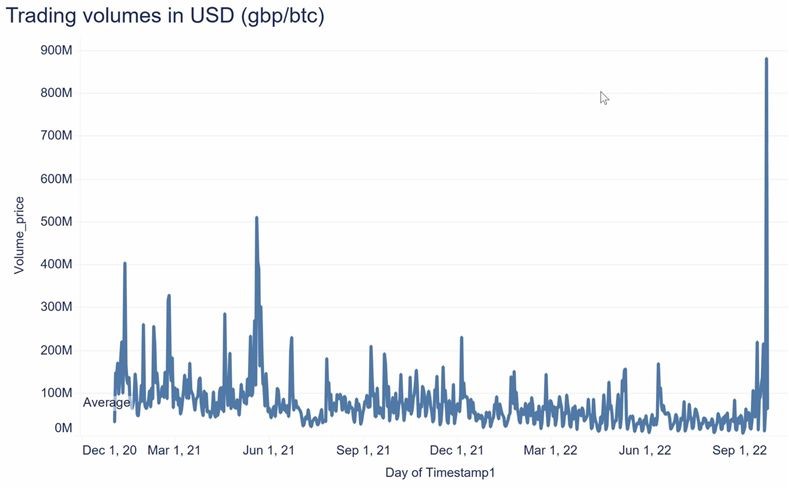
Chart #7 — Will the Brits take refuge in bitcoin?
GBP/BTC trading volume on the Bitstamp and Bitfinex exchanges, which is usually around $70 million per day, reached a staggering $881 million on 26 September (the day of the GBP crisis), an increase of over 1,150%.
Volume (in dollars) on GBP/BTC positions
 Source: Bloomberg