
.png)
Source: BofA
We are sorry that for legal reasons we are not able to help US citizens or Canadian residents other than in Ontario, Quebec, or Alberta. Best wishes for the future…
We are sorry that for legal reasons we are not able to help US citizens or Canadian residents other than in Ontario, Quebec, or Alberta. Best wishes for the future…
You chose the following profile. If you made a mistake, please change here USA
This marketing document has been issued by Bank Syz Ltd. It is not intended for distribution to, publication, provision or use by individuals or legal entities that are citizens of or reside in a state, country or jurisdiction in which applicable laws and regulations prohibit its distribution, publication, provision or use. It is not directed to any person or entity to whom it would be illegal to send such marketing material.
This document is intended for informational purposes only and should not be construed as an offer, solicitation or recommendation for the subscription, purchase, sale or safekeeping of any security or financial instrument or for the engagement in any other transaction, as the provision of any investment advice or service, or as a contractual document. Nothing in this document constitutes an investment, legal, tax or accounting advice or a representation that any investment or strategy is suitable or appropriate for an investor's particular and individual circumstances, nor does it constitute a personalized investment advice for any investor.
This document reflects the information, opinions and comments of Bank Syz Ltd. as of the date of its publication, which are subject to change without notice. The opinions and comments of the authors in this document reflect their current views and may not coincide with those of other
Syz Group entities or third parties, which may have reached different conclusions. The market valuations, terms and calculations contained herein are estimates only. The information provided comes from sources deemed reliable, but Bank Syz Ltd. does not guarantee its completeness, accuracy, reliability and actuality. Past performance gives no indication of nor guarantees current or future results. Bank Syz Ltd. accepts no liability for any loss arising from the use of this document.

Charles-Henry Monchau
Chief Investment Officer
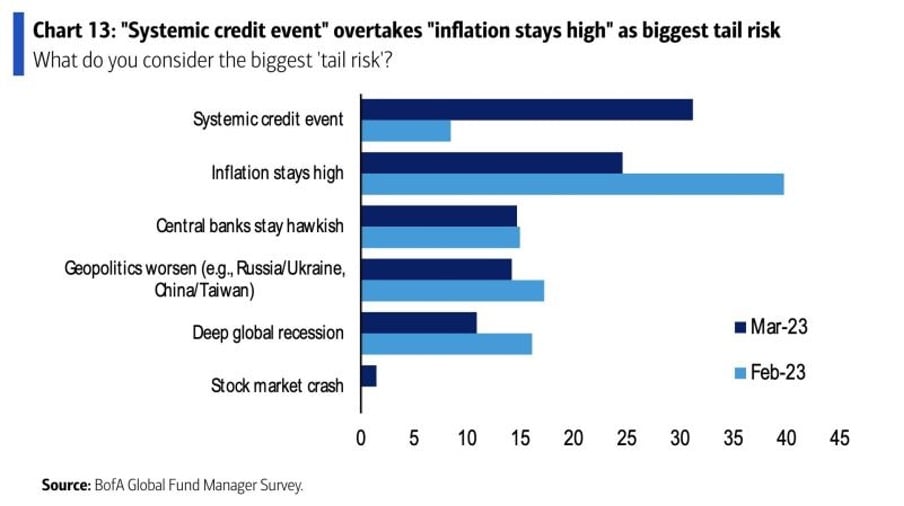
According to the latest Bank of America (BofA) survey of investment fund managers, a credit crisis linked to a systemic borrower is now seen as the main "black swan" in place of an inflation rate that would remain too high over time.
Source: BofA
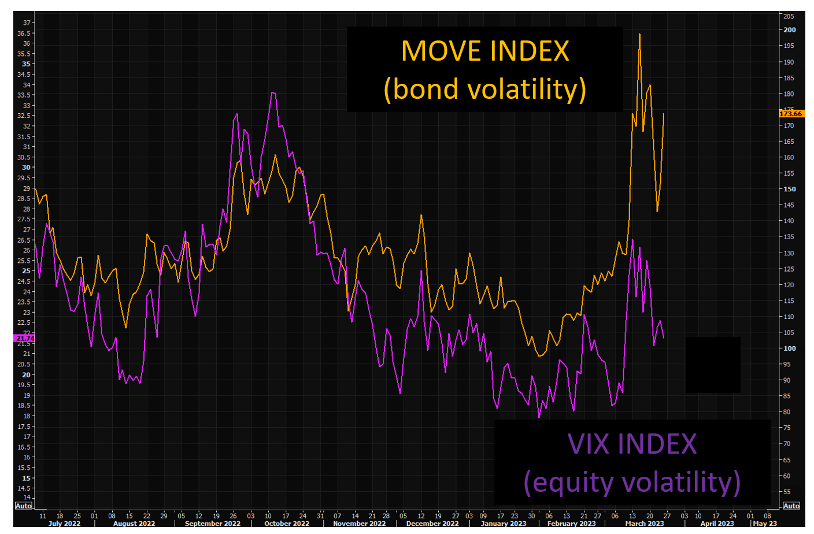
Despite the stress on banks and another rate hike by the Fed, the S&P 500 index gained more than 1% on the week. The implied volatility index on the S&P 500 VIX (purple below) remains near complacent levels (20) while the volatility index on Treasuries MOVE (yellow below) is trading at very high levels. It seems illusory to think that the VIX can remain at such low levels while bond volatility is near record levels.
Source: TME, Refinitiv
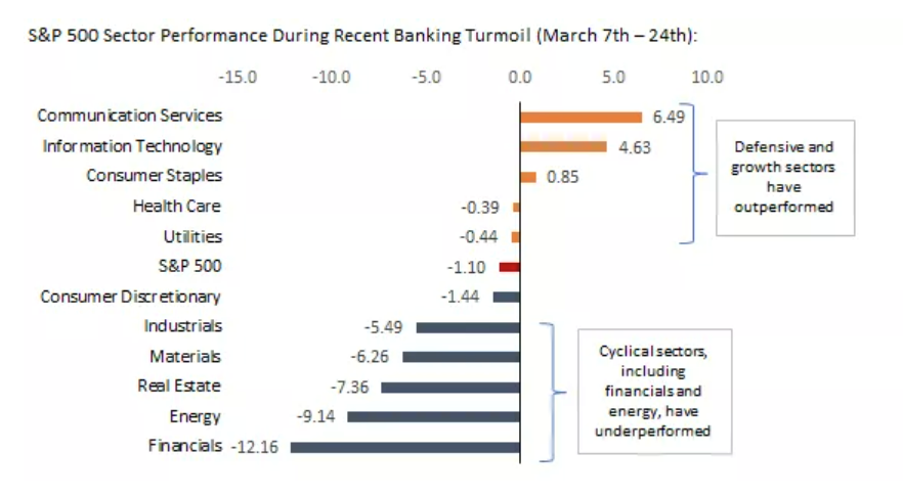
Since the beginning of the banking crisis, defensive stocks (non-cyclical consumption, health care) and technology sectors have been the best performers, while cyclical stocks (industry, basic materials, energy) and financial stocks have strongly underperformed.
 Source: Edward Jones
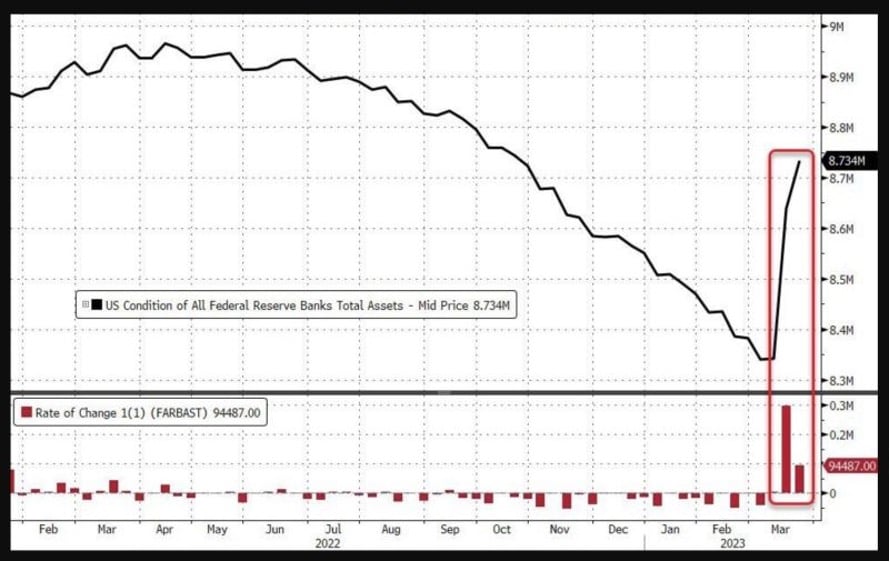
The Fed's balance sheet increased by another $100 billion last week amid a run on bank deposits. As of March 2022, the Fed's balance sheet increased by $94.5 billion, from $8.639 trillion to $8.734 trillion, an increase of $297 billion from the previous week, when the banking crisis began. In total, the Fed's balance sheet has grown by $393 billion in the past two weeks and is rapidly approaching its all-time high of $8.95 trillion reached a year ago when Quantitative Tightening (QT) was triggered. QT reduced the size of the Fed's balance sheet by $600 billion.
This increase in the Fed's balance sheet is part of the reason for the resilience of the equity market. Indeed, many investors are interpreting this reversal as the equivalent of another "QE". We would caution against this interpretation; the increase in the balance sheet is liquidity that is being made available to currently troubled banks. This is not like previous QE phases, which involved bond buybacks with real liquidity consequences - a very different mechanism than the current one.
Source: www.zerohedge.com, Bloomberg
Where is the cash withdrawn from bank deposits going? Here's part of the explanation: the increase in U.S. money market funds outstanding over the past two weeks is the largest since April 2020, with the total amount reaching a record $5.13 trillion.
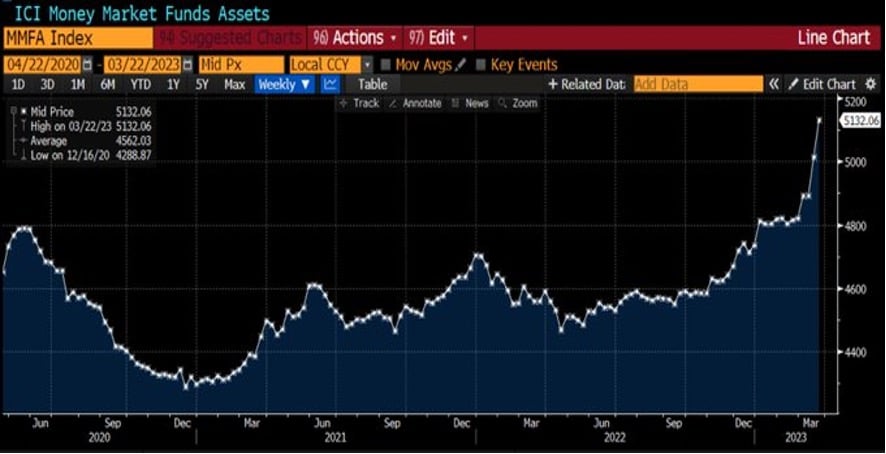
Source: Bloomberg, ICI data
CDS on Deutsche Bank's subordinated debt, which represent insurance for bondholders against a potential default, surged at the end of the week, all amid stress on the banking sector in Europe. The markets estimate the probability of default on these subordinated bonds at 31%. The probability of default is estimated at 16% for Deutsche Bank's senior bonds.
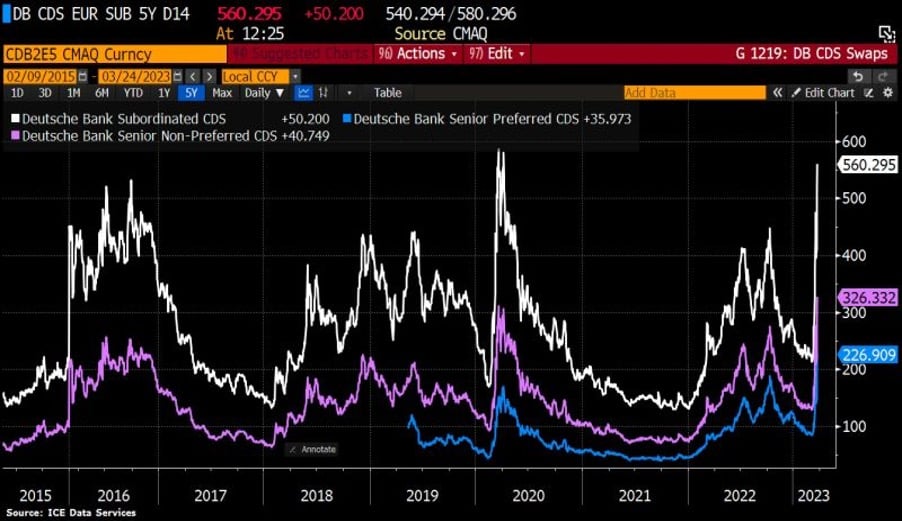
Source: Bloomberg, HolgerZ
Following the announcement of the takeover of Credit Suisse by UBS, the new entity is set to become the world's 3rd largest asset manager (after Blackrock and Vanguard) with over 5 trillion in assets under management.
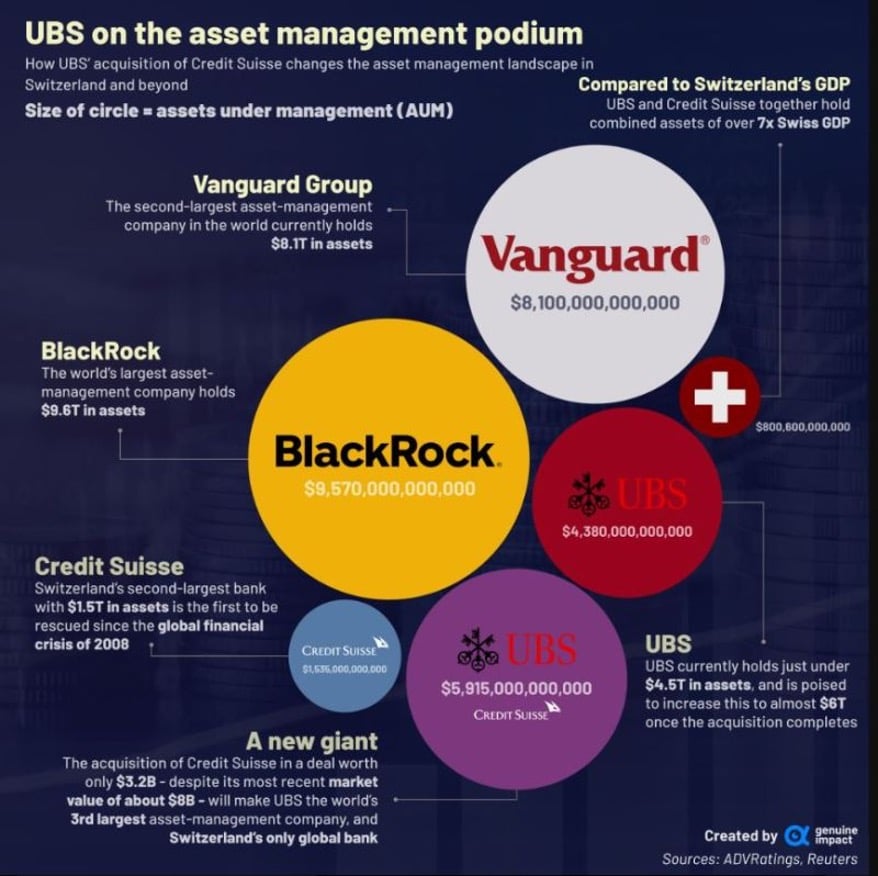
Source: Genuine Impact
This marketing document has been issued by Bank Syz Ltd. It is not intended for distribution to, publication, provision or use by individuals or legal entities that are citizens of or reside in a state, country or jurisdiction in which applicable laws and regulations prohibit its distribution, publication, provision or use. It is not directed to any person or entity to whom it would be illegal to send such marketing material. This document is intended for informational purposes only and should not be construed as an offer, solicitation or recommendation for the subscription, purchase, sale or safekeeping of any security or financial instrument or for the engagement in any other transaction, as the provision of any investment advice or service, or as a contractual document. Nothing in this document constitutes an investment, legal, tax or accounting advice or a representation that any investment or strategy is suitable or appropriate for an investor's particular and individual circumstances, nor does it constitute a personalized investment advice for any investor. This document reflects the information, opinions and comments of Bank Syz Ltd. as of the date of its publication, which are subject to change without notice. The opinions and comments of the authors in this document reflect their current views and may not coincide with those of other Syz Group entities or third parties, which may have reached different conclusions. The market valuations, terms and calculations contained herein are estimates only. The information provided comes from sources deemed reliable, but Bank Syz Ltd. does not guarantee its completeness, accuracy, reliability and actuality. Past performance gives no indication of nor guarantees current or future results. Bank Syz Ltd. accepts no liability for any loss arising from the use of this document.
Meanwhile, Wall Street's long-term earnings expectations for the S&P 500 are now at record levels. Each week, the Syz investment team takes you through the last seven days in seven charts.
Meanwhile, corporate leadership is evolving rapidly: only 135 of the S&P 500 constituents from 1996 are still in the index today, while the EU goods trade deficit with China is close to a record €376bn. Each week, the Syz investment team takes you through the last seven days in seven charts.
Meanwhile, Trump’s personal crypto earnings in 2025 topped the combined profits of every publicly listed US crypto company. Each week, the Syz investment team takes you through the last seven days in seven charts.
Live feeds, charts, breaking stories, all day long.
Our latest research, commentary and market outlooks