Charles-Henry Monchau

Chief Investment Officer

Chart #1 — 

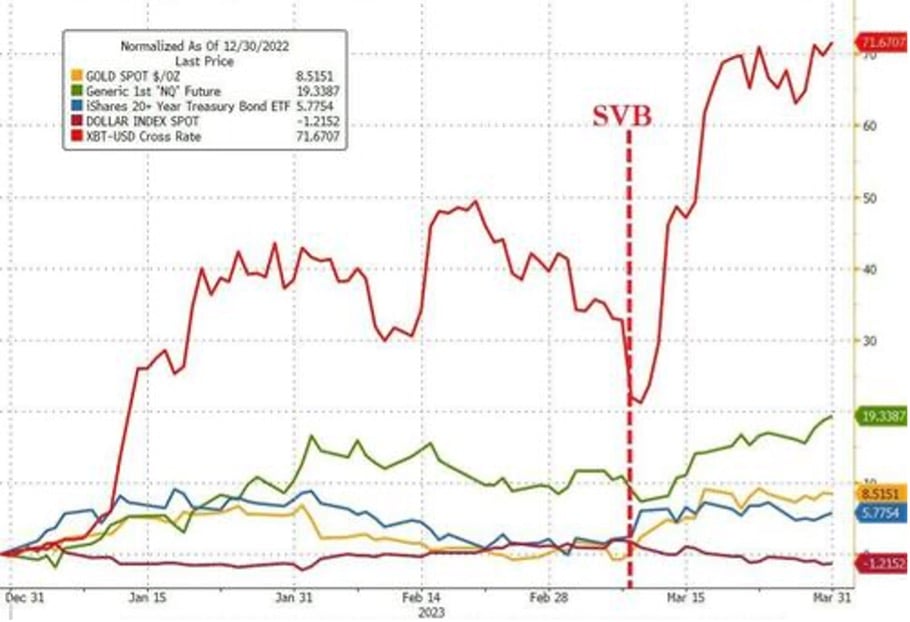
Bitcoin is the best performing asset in Q1 2023 

After crashing in 2022, bitcoin recorded a 70% rebound in the first three months of the year. Meanwhile, gold is up nearly 9% and the dollar is down for the 2nd consecutive quarter. Bonds and equities also rose in the first quarter. However, there was a divergence in performance among the major U.S. equity indices: while the Nasdaq gained 9% (its best quarterly performance since Q2 2020), the Dow Jones Industrial Index and the Russell 2000 small and mid-cap index ended the quarter virtually unchanged. European equities posted mixed performances: Germany gained more than 12% while the United Kingdom declined over the quarter. The Nikkei 225 rose by 7.5% and the Chinese CSI 300 index by 4.6%.

Picture1-Apr-03-2023-01-56-50-3272-PM

Source: www.zerohedge.com, Bloomberg


Chart #2 — 

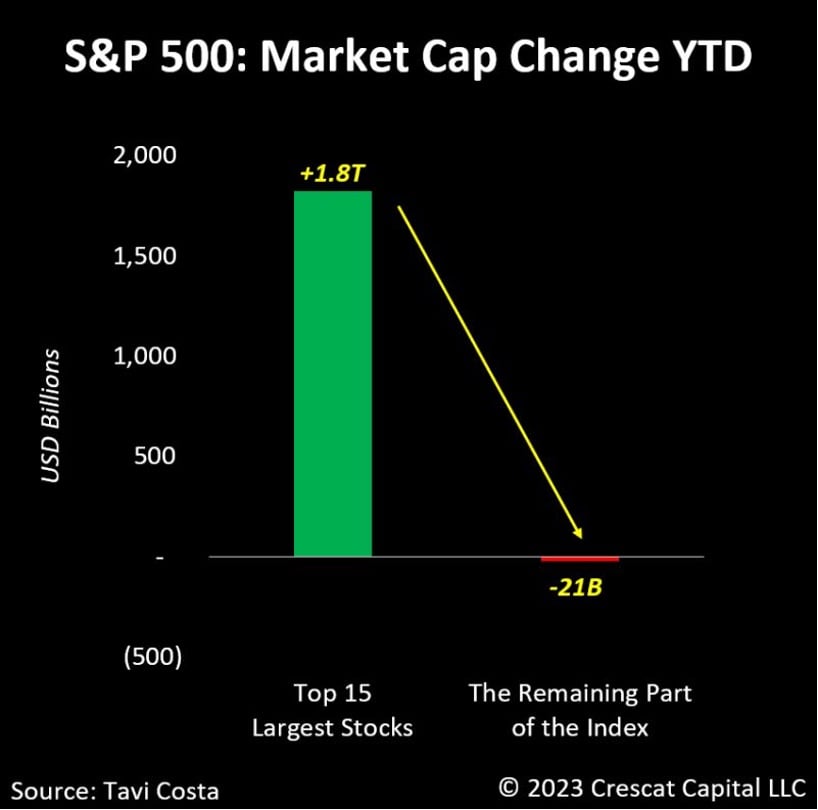
The S&P 500 Index's Q1 gain came from just 15 stocks


The S&P 500's year-to-date increase (+6% or $1.8 trillion) was generated by the 15 largest companies represented in the index. The rest of the index has actually lost value since the beginning of the year. This statistic shows that the rise of stocks in 2023 is currently based on a very limited number of highly performing stocks. It is primarily the mega-cap technology stocks that have kept the equity market afloat. 

Picture2-Apr-03-2023-01-58-23-5540-PM

Source: Crescat Capital, Bloomberg


Chart #3 — 

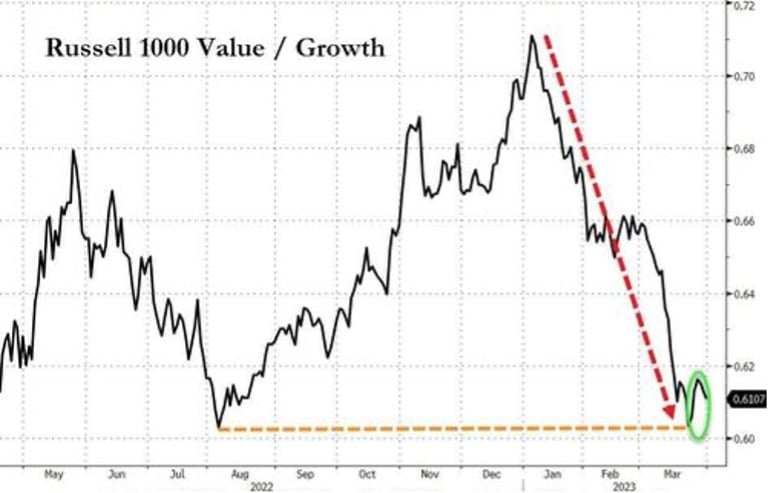
Strong outperformance of the growth style vs. value 


U.S. growth stocks dominated the first quarter - thanks in particular to the very strong performance of GAFAs but also due to the underperformance of financials and energy stocks. The outperformance of the growth style vs. the value style was the largest since the first quarter of 2020.  

Picture3-Apr-03-2023-01-59-36-8671-PM

Source: Bloomberg, www.zerohedge.com


Chart #4 — 

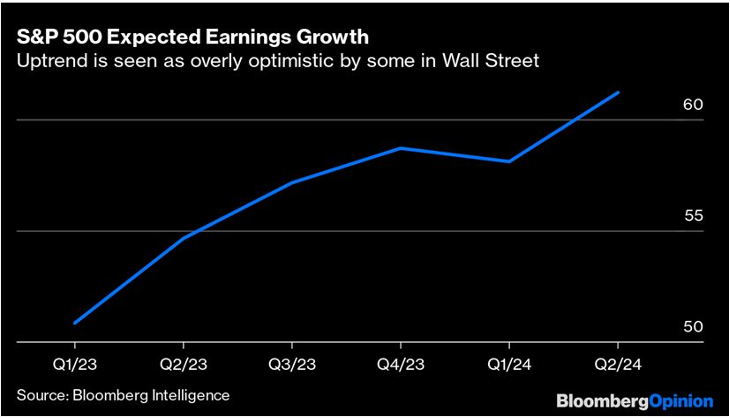
Earnings expectations for the S&P 500 at a new high


Is there a disconnect between analysts' consensus earnings projections and the economic slowdown expected later this year? The S&P 500 quarterly earnings consensus compiled by Bloomberg Intelligence shows an upward trend. They rose from $50.85 in the first quarter of 2023 to $54.64 in the next quarter, and then to $57.16 and $58.68 in the third and fourth quarters, respectively, according to a March 24 note by Wendy Soong of Bloomberg Intelligence. For the full year of 2023, the consensus forecast calls for earnings per share of $219.6 and $244.5 for 2024.

Picture4-Apr-03-2023-02-00-26-8440-PM

Source: Bloomberg


Chart #5 — 

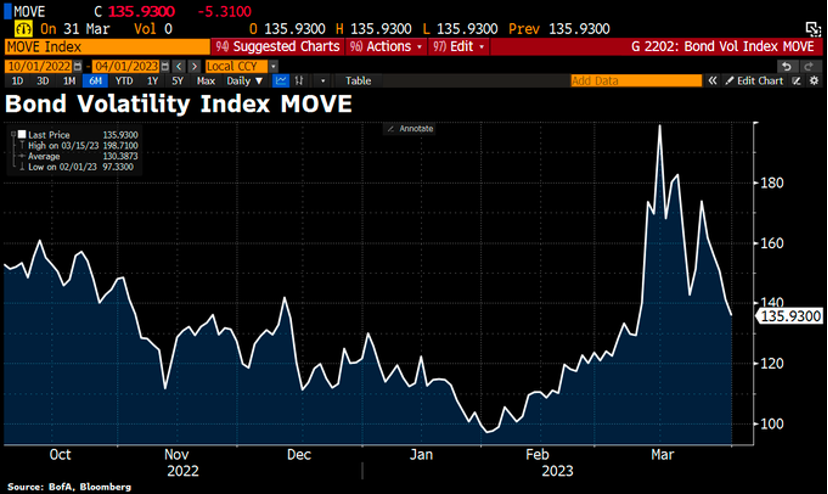
Volatility is more apparent in US bonds than in equity markets

The CBOE VIX index (implied volatility of the S&P 500) fell back below 20. Volatility is highest in the bond markets. Indeed, the MOVE index, which measures the implied volatility of U.S. Treasury bonds, is the indicator that highlights the current tensions in the financial system, even though the index lost quite a few points at the end of the quarter.  The index's creator, Harley Bassman, said that a MOVE above 150 is a symptom of the Fed losing control of the bond market. A loosening of the MOVE index last week therefore indicates that the stress in the bond market has begun to ease.  

Picture5-Apr-03-2023-02-01-36-7964-PM

Source: Bloomberg


Chart #6 — 

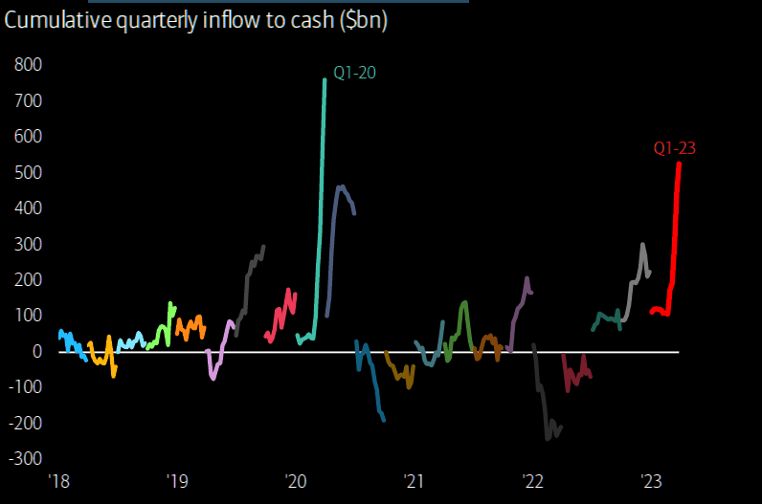
In the US, more than $500 billion was invested in money market funds in the first quarter 

Deposits at commercial banks fell $125.7 billion in the week ending March 22, marking the 9th consecutive period of decline, underscoring savers' preference for the high interest rates paid by money market funds.

Total assets in U.S. money market funds reached a new all-time high of $5.1 trillion, an increase of $600 billion over the past 12 months and a two-fold increase in five years. 

Investors pumped some $508 billion into these funds in 1Q23. You have to go back to the spring of 2020 to see such inflows. 

Picture6-Apr-03-2023-02-02-40-9061-PM

Source: The Market Ear 


Chart #7 — 

Inflation drops in the US and Europe


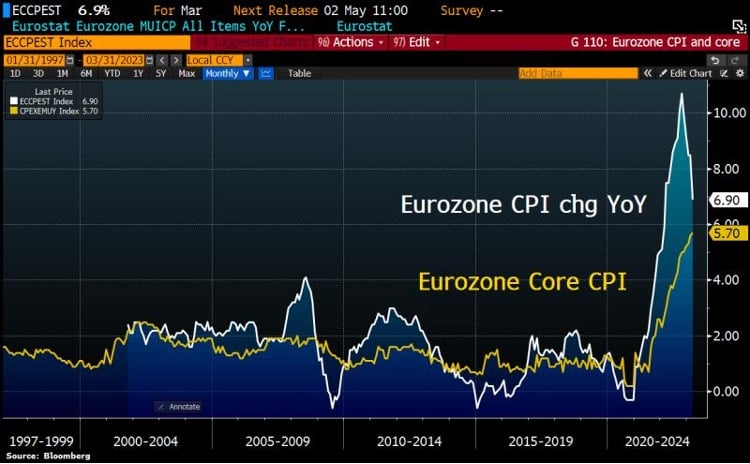
There was further evidence last week that the rate of inflation in the United States is dropping. The PCE price index fell to 5%, its lowest level since September 2021. The peak was 7 percent in June 2022. In Europe, headline inflation slowed considerably to 6.9% y/y in March from 8.5% in February; this is the lowest level since February 2022.In contrast, core inflation, which excludes volatile items such as energy and food, accelerated to 5.7% in March; this is a new all-time high, demonstrating that inflationary pressure in the Eurozone remains high.

Picture7-Apr-03-2023-02-03-40-1494-PM

Source: Bloomberg

Disclaimer

This marketing document has been issued by Bank Syz Ltd. It is not intended for distribution to, publication, provision or use by individuals or legal entities that are citizens of or reside in a state, country or jurisdiction in which applicable laws and regulations prohibit its distribution, publication, provision or use. It is not directed to any person or entity to whom it would be illegal to send such marketing material. This document is intended for informational purposes only and should not be construed as an offer, solicitation or recommendation for the subscription, purchase, sale or safekeeping of any security or financial instrument or for the engagement in any other transaction, as the provision of any investment advice or service, or as a contractual document. Nothing in this document constitutes an investment, legal, tax or accounting advice or a representation that any investment or strategy is suitable or appropriate for an investor's particular and individual circumstances, nor does it constitute a personalized investment advice for any investor. This document reflects the information, opinions and comments of Bank Syz Ltd. as of the date of its publication, which are subject to change without notice. The opinions and comments of the authors in this document reflect their current views and may not coincide with those of other Syz Group entities or third parties, which may have reached different conclusions. The market valuations, terms and calculations contained herein are estimates only. The information provided comes from sources deemed reliable, but Bank Syz Ltd. does not guarantee its completeness, accuracy, reliability and actuality. Past performance gives no indication of nor guarantees current or future results. Bank Syz Ltd. accepts no liability for any loss arising from the use of this document.
Read More

Straight from the Desk

Syz the moment

Live feeds, charts, breaking stories, all day long.

Thinking out loud

Sign up for our weekly email highlighting the most popular posts.

Follow us

Thinking out loud

Investing with intelligence

Our latest research, commentary and market outlooks