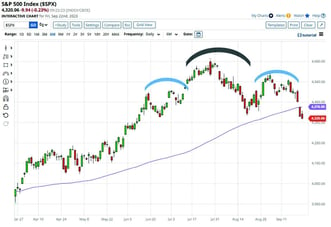
Charles-Henry Monchau

Chief Investment Officer

Chart #1 — 

Third consecutive week of declines for the S&P 500

The Fed's decision and speech (see chart #2) do not seem to have reassured the financial markets. The S&P 500 index fell by 2.9% over the week. This is the third consecutive negative week and the worst weekly performance since March. Is the "head and shoulders" configuration of the S&P 500 beginning to take hold?

WeekIn7Charts_230925_01

source: Barchart


Chart #2 — 

The Fed decides to take a pause in the rate hike cycle but leaves the door open to further monetary tightening

As expected, the US Federal Reserve decided to leave interest rates unchanged, keeping the benchmark rate within the target range of 5.25% to 5.5%. 
12 Fed members are forecasting a further rate hike at upcoming meetings, while 7 members are no longer forecasting one. The dot plot of rate projections shows that US monetary policymakers are still expecting another rate hike this year. Also, the rate projections for 2024 and 2025 have all risen by half a percentage point, indicating that the Fed expects rates to remain higher for longer.
The Fed is forecasting inflation of 2.6% in 2024. The median projection for economic growth in 2023 is raised from 1% in June to 2.1%; officials significantly cut unemployment forecasts and now expect the unemployment rate to peak at 4.1%, rather than 4.5%. It should be noted that the Fed acknowledges that job creation has "slowed» but affirms that it "remains strong".

The market has de facto revised the path of interest rates upwards: the Fed's futures contracts no longer point to rate cuts before September 2024. To put things in perspective, three months ago, the futures contracts were forecasting 4 rate cuts in 2023. Today, the market expects interest rates to pause for at least a year.
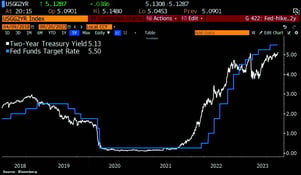
WeekIn7Charts_230925_02

Source:  Bloomberg


Chart #3 — 

US bond yields continue to rise

Following the Federal Reserve's decision, bond yields on US Treasuries continued to rise. US 2-year yields reached its highest level since July 2006, US 5-year yields its highest since August 2007, 10-year yields its highest since November 2007 and 30-year yields its highest since April 2011.

WeekIn7Charts_230925_03

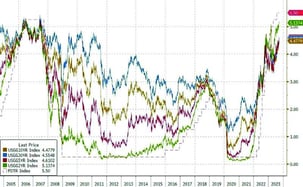
Source: www.zerohedge.com, Bloomberg


Chart #4 — 

How to lose 60% with an ETF on US Treasury bonds?

The PIMCO 25+ Year Zero coupon US Treasuries ETF ($ZROZ) is down 60% since its March 2020 high. At the height of the Covid crisis, 30-year US Treasury yields were at an all-time low of 0.8%. Today, yields on similar maturities are 4.6%. This sharp rise in yields combined with the very long duration of these bonds explains the sharp fall in this ETF.

WeekIn7Charts_230925_04

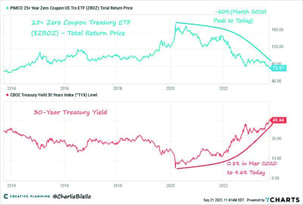
Source: Charlie Bilello


Chart #5 — 

The SNB is leaving interest rates unchanged. This decision probably marks the end of rate hikes for this cycle

The SNB left its key rate unchanged at 1.75%, thwarting market expectations of a further 25 basis point rise.
Underlying this decision are the slowdown in inflation, the extent of the monetary policy tightening already implemented (short-term Swiss franc rates were still negative a year ago) and the growing risks surrounding the global outlook.
Indeed, with inflation in line with the SNB's target (1.6%, within the 0%-2% range), economic activity slowing (0% GDP growth in the second quarter of 2023) and the Swiss franc remaining firm, the case for further tightening had become much less convincing in recent weeks. Unlike the ECB, which was forced to raise rates the previous week because inflation was still well above its target, the SNB had very good reasons to pause and adopt a cautious stance. However, the SNB is not ruling out further hikes in the future, if necessary. 

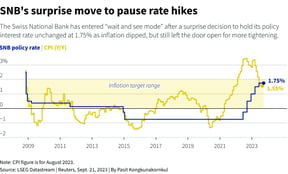
It is also interesting to compare the SNB's decision and body language with those of the Fed and the ECB. Indeed, Mrs. Lagarde and Mr. Powell left an impression of great confusion. On the one hand, they were  obliged to acknowledge that the battle against inflation was not yet won. On the other, they shared their fears about the impact of higher rates on the economic cycle. In the case of the SNB, things are much clearer. Inflation is already within the SNB's target range. Activity is slowing down. These two factors allow the SNB to come up with a clear and unambiguous decision: the end of rate hikes for this cycle. And if economic activity were to accelerate or slow too much, the SNB has several options available.

WeekIn7Charts_230925_05

Source: Bloomberg


Chart #6 — 

Bankruptcies are on the rise and it is a worldwide phenomena

The number of bankruptcies is definitely on the rise, and this is a global trend. While the rate hike cycle is not having any effect on large caps for the time being, smaller companies are much more affected.

WeekIn7Charts_230925_06

Source: Charles Schwab, Bloomberg


Chart #7 — 

A $28 billion acquisition for Cisco Systems

Cisco is buying cybersecurity software vendor Splunk for $157 per share in a cash deal worth around $28 billion, the company announced on Thursday. It is the largest acquisition in the company's history. The chart below shows how this acquisition ranks among the largest in the history of the technology sector.

WeekIn7Charts_230925_07

Source: App Economy Insights


Disclaimer

This marketing document has been issued by Bank Syz Ltd. It is not intended for distribution to, publication, provision or use by individuals or legal entities that are citizens of or reside in a state, country or jurisdiction in which applicable laws and regulations prohibit its distribution, publication, provision or use. It is not directed to any person or entity to whom it would be illegal to send such marketing material. This document is intended for informational purposes only and should not be construed as an offer, solicitation or recommendation for the subscription, purchase, sale or safekeeping of any security or financial instrument or for the engagement in any other transaction, as the provision of any investment advice or service, or as a contractual document. Nothing in this document constitutes an investment, legal, tax or accounting advice or a representation that any investment or strategy is suitable or appropriate for an investor's particular and individual circumstances, nor does it constitute a personalized investment advice for any investor. This document reflects the information, opinions and comments of Bank Syz Ltd. as of the date of its publication, which are subject to change without notice. The opinions and comments of the authors in this document reflect their current views and may not coincide with those of other Syz Group entities or third parties, which may have reached different conclusions. The market valuations, terms and calculations contained herein are estimates only. The information provided comes from sources deemed reliable, but Bank Syz Ltd. does not guarantee its completeness, accuracy, reliability and actuality. Past performance gives no indication of nor guarantees current or future results. Bank Syz Ltd. accepts no liability for any loss arising from the use of this document.

Read More

Straight from the Desk

Syz the moment

Live feeds, charts, breaking stories, all day long.

Thinking out loud

Sign up for our weekly email highlighting the most popular posts.

Follow us

Thinking out loud

Investing with intelligence

Our latest research, commentary and market outlooks