Charles-Henry Monchau

Chief Investment Officer

Chart #1 — 

US inflation takes a holiday

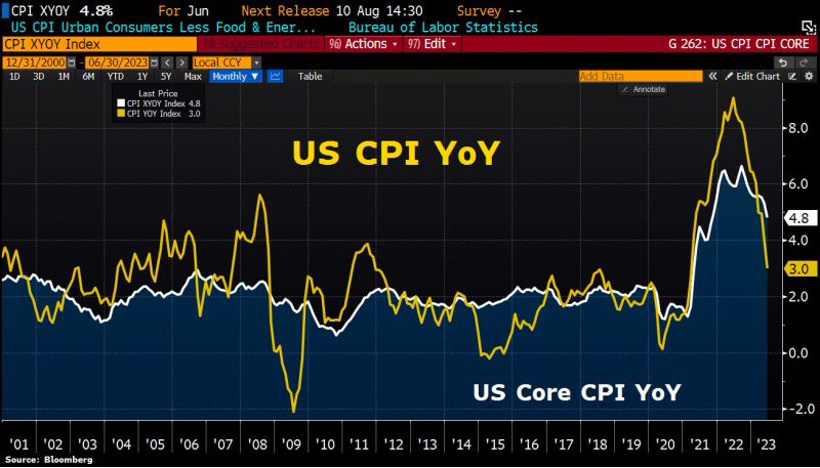
This was the most eagerly awaited macroeconomic figure of the week. US inflation slowed again in June, with both the core and headline CPI indices rising sequentially by +0.2% (versus 0.3% expected).

On a year-on-year basis, the CPI reached +3% against expectations of +3.1%, the lowest level since March 2021. The core CPI is now +4.8% year-on-year, compared with +5% expected.

This marks the 12th consecutive month of year-on-year declines in headline CPI, the longest streak of declines in history (since 1921).

pic 1-Jul-18-2023-12-09-59-0583-PM

Source: Bloomberg


Chart #2 — 

Despite the fall in inflation, the market is still expecting the Fed to raise rates at the July FOMC meeting. 


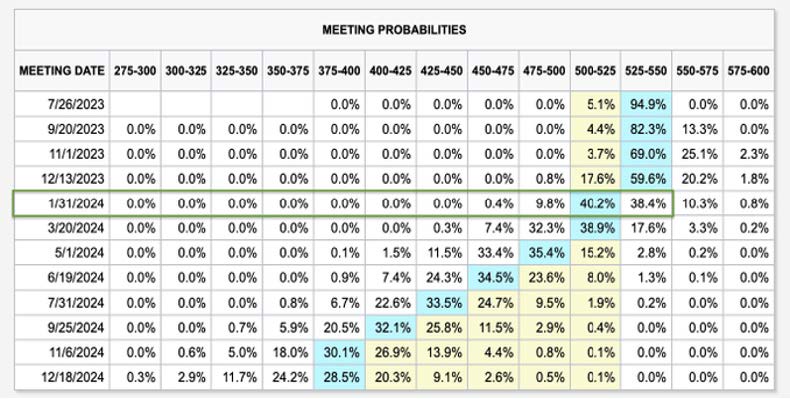
Following the publication of lower-than-expected CPI and PPI figures, US interest rate futures now give a 94% probability of a rate hike at the Fed's July meeting. The yield curve points to a possible first rate cut in January 2024 (40% probability).

Before the release of the inflation figures, the market was not expecting a rate cut before March. 

Will the Fed bow to market expectations and signal its willingness to implement a less restrictive monetary policy?

pic 2-Jul-18-2023-12-12-03-6795-PM

Source: Markets & Mayhem


Chart #3 — 

Falling bond yields


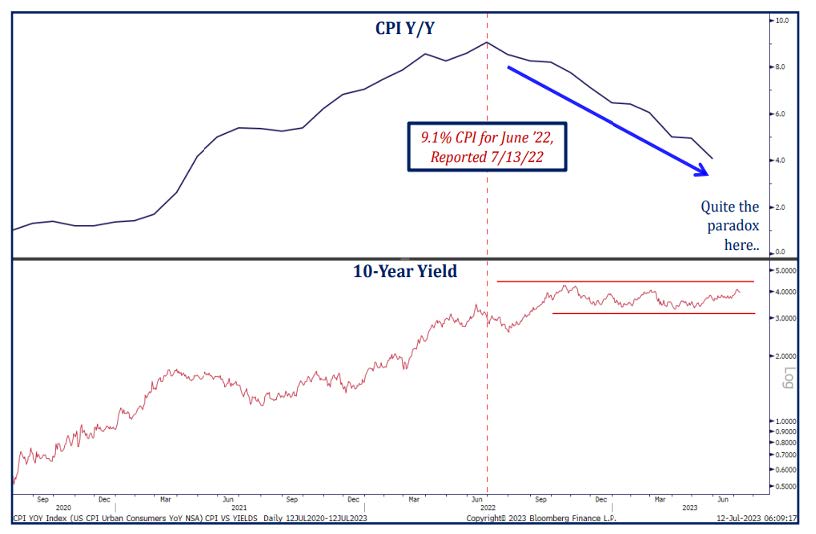
Treasury yields fell significantly over the week. In fact, this was the biggest weekly fall in yields since March. Note that the fall in yields was more marked on the short end than the long end.  There is one paradox, however: 10-year yields are at roughly the same level as they were when inflation was at 9%. 

pic 3-Jul-18-2023-12-15-04-0457-PM

Source: Strategas 


Chart #4 — 

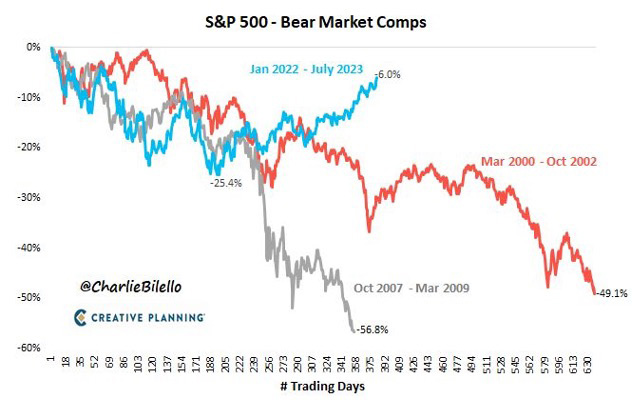
The assumption of a prolonged bear market seems to be receding  


The behaviour of the S&P 500 following the bear market of 2022 is very different from what was seen in 2000-2002 and 2007-2009. The chart below compares the index's performance since the market peak (January 2022 for the current cycle). The S&P 500 is now 3% higher than it was when the Fed began raising rates in March 2022.

pic 4-Jul-18-2023-12-16-16-3600-PM

Source: Charlie Bilello


Chart #5 — 

Will the available cash be reinvested in the equity markets?  


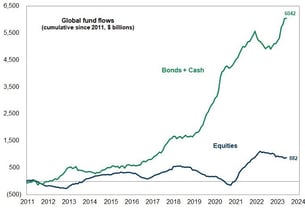
Is this the biggest risk for bears? As Goldman has pointed out, there is a $5 trillion 'gap' between the flow of funds into money markets and bonds, on the one hand, and equities, on the other. As investors realise that the much-feared recession will not happen, they may be inclined to return to risky assets. 

pic 6-Jul-18-2023-12-17-57-6760-PM

Source:  Goldman Sachs


Chart #6 — 

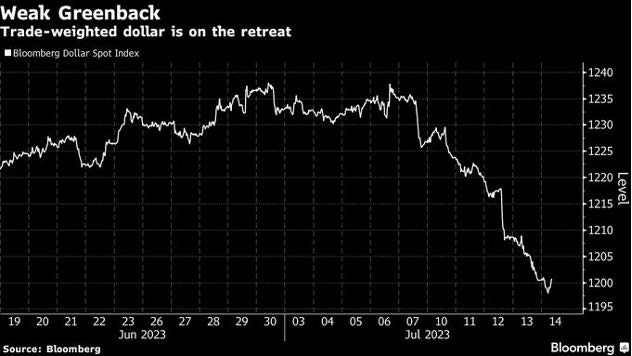
The US dollar in free fall 


The dollar's weakness continues to have an impact on the markets. The euro, Swiss franc, pound and yen all appreciated against the dollar last week following the publication of US inflation figures. The dollar index has fallen for five of the last six days, recording its second biggest weekly fall (-2%) since March 2020. The Bloomberg Dollar Index has returned to its levels prior to the COVID crisis. 

pic 7-Jul-18-2023-12-19-01-9491-PM

Source:  Bloomberg


Chart #7 — 

Africa and commodities 


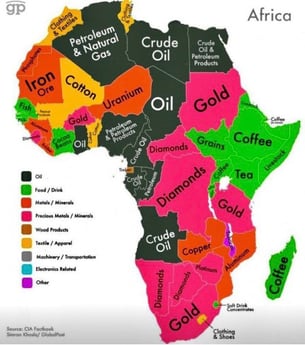
Africa has around 12% of the world's oil reserves, 42% of the world's gold, 80-90% of the world's chromium, 60% of the world's arable land and vast timber resources.

pic 8-3


Disclaimer

This marketing document has been issued by Bank Syz Ltd. It is not intended for distribution to, publication, provision or use by individuals or legal entities that are citizens of or reside in a state, country or jurisdiction in which applicable laws and regulations prohibit its distribution, publication, provision or use. It is not directed to any person or entity to whom it would be illegal to send such marketing material. This document is intended for informational purposes only and should not be construed as an offer, solicitation or recommendation for the subscription, purchase, sale or safekeeping of any security or financial instrument or for the engagement in any other transaction, as the provision of any investment advice or service, or as a contractual document. Nothing in this document constitutes an investment, legal, tax or accounting advice or a representation that any investment or strategy is suitable or appropriate for an investor's particular and individual circumstances, nor does it constitute a personalized investment advice for any investor. This document reflects the information, opinions and comments of Bank Syz Ltd. as of the date of its publication, which are subject to change without notice. The opinions and comments of the authors in this document reflect their current views and may not coincide with those of other Syz Group entities or third parties, which may have reached different conclusions. The market valuations, terms and calculations contained herein are estimates only. The information provided comes from sources deemed reliable, but Bank Syz Ltd. does not guarantee its completeness, accuracy, reliability and actuality. Past performance gives no indication of nor guarantees current or future results. Bank Syz Ltd. accepts no liability for any loss arising from the use of this document.
Read More

Straight from the Desk

Syz the moment

Live feeds, charts, breaking stories, all day long.

Thinking out loud

Sign up for our weekly email highlighting the most popular posts.

Follow us

Thinking out loud

Investing with intelligence

Our latest research, commentary and market outlooks