Charles-Henry Monchau

Chief Investment Officer

pdf

Chart #1 — 

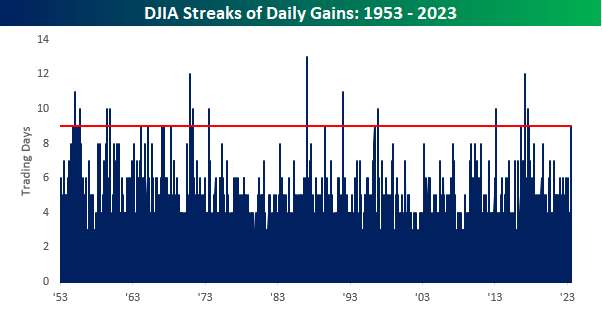
The Dow Jones is up for 10 consecutive sessions

U.S. stock market indices rose last week. The market consensus now assumes a soft landing for the economy, a scenario which is favorable to risky assets. The Dow Jones has now risen for 10 consecutive days, the longest such streak since 2017, a year in which three streaks of 9 days or more were recorded (9, 10 and 12). Apart from 2017, the only other year with at least three 9-day winning streaks was 1955.


Picture1-Jul-24-2023-01-05-24-4788-PM

Source: Bespoke


Chart #2 — 

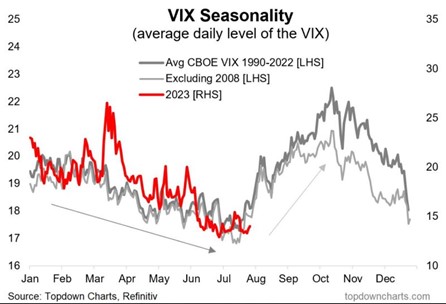
Beware of VIX seasonality


The calm before the storm? While the VIX (aka the “fear index”) has been evolving at a relatively low level for several months, a study of VIX seasonality shows that it tends to increase in summer and early autumn.

Picture2-Jul-24-2023-01-09-09-9755-PM

Source: Top down charts


Chart #3 — 

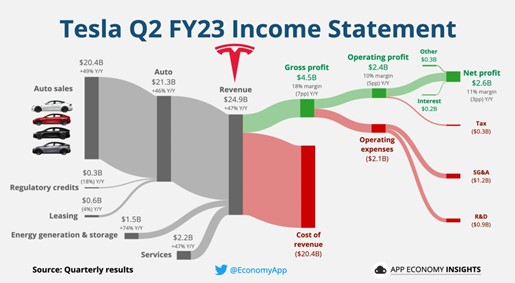
Tesla reports mixed quarterly results


Tesla published its Q2 results last Wednesday, reporting record quarterly sales, but lower margins due to price cuts and incentives. Another disappointment for investors was that Elon Musk and Tesla's management did not provide any additional information or delivery dates for Tesla's two main projects, the Cybertruck and the robo-taxi vehicle. The share price fell sharply over the week (-8%).

Picture3-Jul-24-2023-01-11-54-1973-PM

Source : App Economy Insights


Chart #4 — 

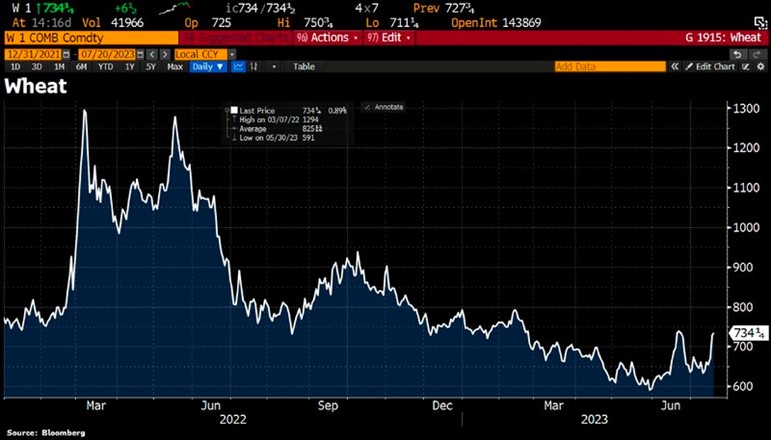
The wheat war


Wheat prices continue to rise following Ukraine's warning against Russian vessels, in response to a similar warning from Moscow. Both Ukraine and Russia are major grain exporters, and Ukraine's exports have been severely restricted by the war. Black Sea ports are an important exit point for exports.

Picture4-Jul-24-2023-01-51-11-4167-PM

Source: Bloomberg, HolgerZ


Chart #5 — 

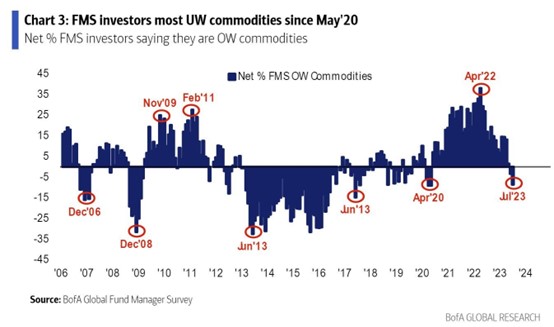
Fund managers are underweighted in commodities


According to BofA's latest survey, fund managers are now underweight commodities. Sentiment hasn't been this negative since 2020, the year crude oil futures traded below zero for a few sessions.

Picture5-Jul-24-2023-01-52-14-2656-PM

Source:  BofA, Global Research


Chart #6 — 

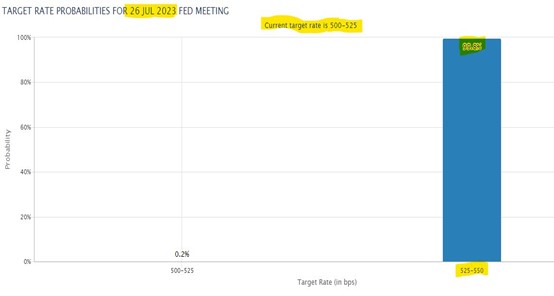
Fed to raise key interest rates this week


The probability of a Fed rate hike at this week's FOMC meeting is close to 100%. The US Federal Reserve is therefore likely to raise rates by 25 basis points to 5.25-5.50%.

Picture6-Jul-24-2023-01-54-20-7665-PM

Source:  Charlie Biello


Chart #7 — 

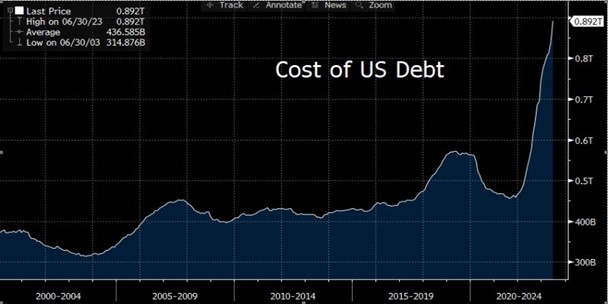
The cost of US debt continues to soar


As a result of the rising cost of money, the interest burden on US debt continues to soar. The cost of U.S. debt is now close to a billion dollars a year. In June alone, 18% of total U.S. spending was devoted to interest charges.

Picture7-Jul-24-2023-01-55-38-8219-PM

Source: Bloomberg, Goldman Sachs

Disclaimer

This marketing document has been issued by Bank Syz Ltd. It is not intended for distribution to, publication, provision or use by individuals or legal entities that are citizens of or reside in a state, country or jurisdiction in which applicable laws and regulations prohibit its distribution, publication, provision or use. It is not directed to any person or entity to whom it would be illegal to send such marketing material. This document is intended for informational purposes only and should not be construed as an offer, solicitation or recommendation for the subscription, purchase, sale or safekeeping of any security or financial instrument or for the engagement in any other transaction, as the provision of any investment advice or service, or as a contractual document. Nothing in this document constitutes an investment, legal, tax or accounting advice or a representation that any investment or strategy is suitable or appropriate for an investor's particular and individual circumstances, nor does it constitute a personalized investment advice for any investor. This document reflects the information, opinions and comments of Bank Syz Ltd. as of the date of its publication, which are subject to change without notice. The opinions and comments of the authors in this document reflect their current views and may not coincide with those of other Syz Group entities or third parties, which may have reached different conclusions. The market valuations, terms and calculations contained herein are estimates only. The information provided comes from sources deemed reliable, but Bank Syz Ltd. does not guarantee its completeness, accuracy, reliability and actuality. Past performance gives no indication of nor guarantees current or future results. Bank Syz Ltd. accepts no liability for any loss arising from the use of this document.
Read More

Straight from the Desk

Syz the moment

Live feeds, charts, breaking stories, all day long.

Thinking out loud

Sign up for our weekly email highlighting the most popular posts.

Follow us

Thinking out loud

Investing with intelligence

Our latest research, commentary and market outlooks