Charles-Henry Monchau

Chief Investment Officer

pdf

Chart #1 — 

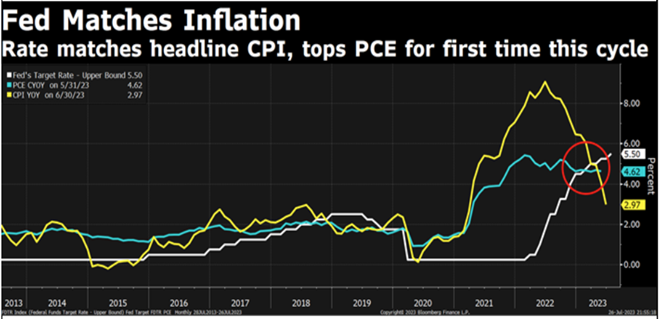
Fed matches inflation

Last week was another one of “goldilocks data”, i.e the economy is running neither too hot nor too cold. A batch of data published over the last few days points to a higher probability of a soft landing. Indeed, recent figures show that the US economy has remained resilient despite the most aggressive rate hike cycle since the ‘80s. Meanwhile, inflation continues to cool down. For the 1st time in this cycle, Fed rates match headline CPI but also tops PCE (Personal Consumption Expenditure) index. This fuels speculation that the Fed is nearly done.


Picture1-Jul-31-2023-09-08-11-5366-AM

Source: Bloomberg


Chart #2 — 

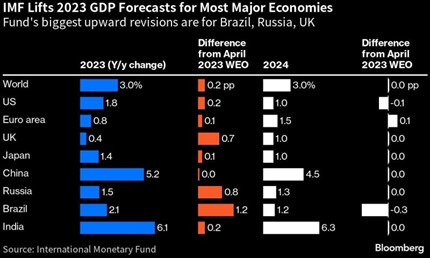
IMF lifts 2023 GDP forecasts for most major economies

Latest outlook from IMF shows expectation for global growth this year up to +3% year/year; 2024 growth also at +3% … expectation is for U.S. to grow 1.8% this year, 0.2%-point increase from April; China expected to grow 5.2%, unchanged from April.

pic2-1

Source: Bloomberg


Chart #3 — 

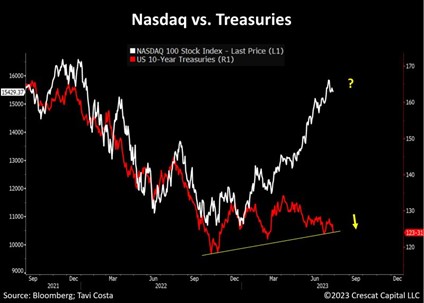
The Nasdaq vs. US Treasury divergence

The chart below courtesy of Crescat Capital / Tavi Costa is a reminder of the divergence between rising US Treasury yields and the highly valued Nasdaq index. Is this divergence sustainable?

Picture3-Jul-31-2023-09-10-40-8010-AM

Source : Crescat Capital


Chart #4 — 

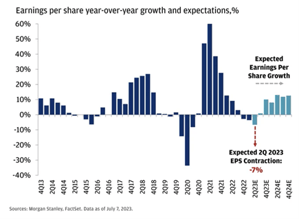
S&P 500 earnings are expected to re-accelerate in 2024


While S&P 500 earnings per share are expected to contract by 7% yoy in 2Q 2023, consensus is pricing in robust growth and no recession next year.

Picture4-Jul-31-2023-09-11-50-7787-AM

Source: Morgan Stanley


Chart #5 — 

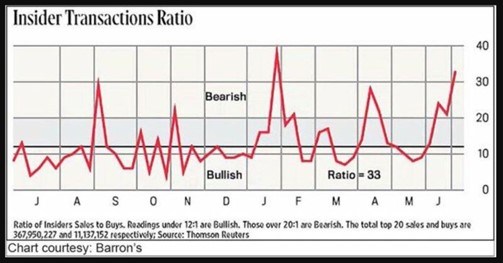
US insiders are bearish


Barron's insider ratio has turned bearish. What do they know that retail investors don't? (This is the ratio of insider's sales to buys - readings under 12:1 are bullish. Those over 20:1 are bearish)

Picture5-Jul-31-2023-09-12-56-8987-AM

Source:  Barron’s


Chart #6 — 

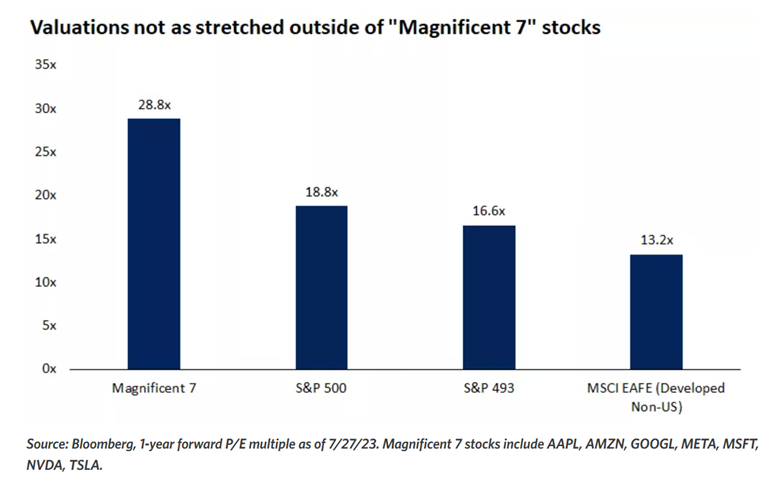
Not all equity valuations are equal


The valuations of the seven leading large-cap technology stocks (Magnificent 7), which are much higher than the rest of the S&P 500 and International stocks.

Picture6-Jul-31-2023-09-13-57-7651-AM

Source: Bloomberg


Chart #7 — 

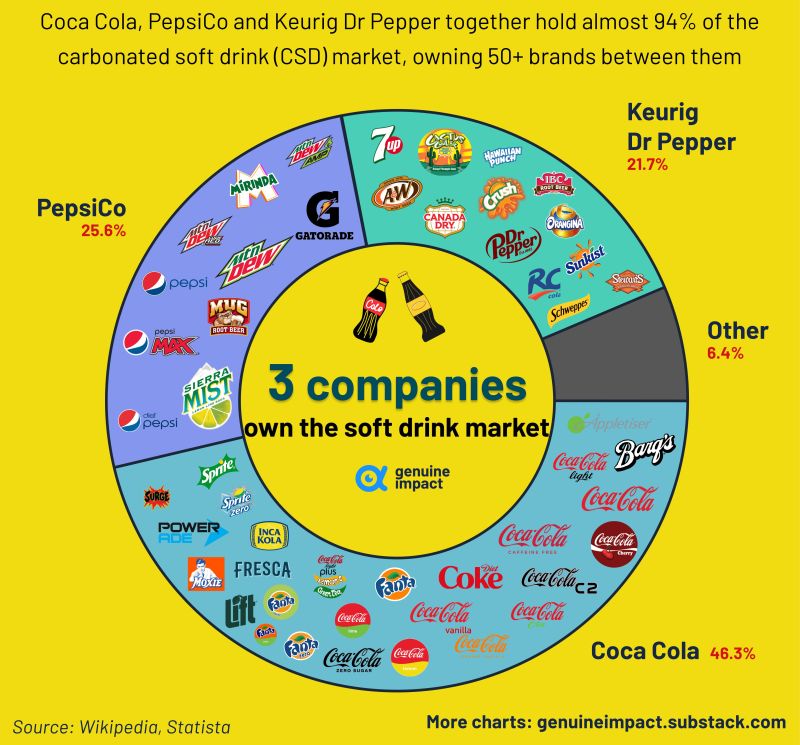
3 companies own the soft drink market


Coca-Cola, PepsiCo and Keurig Dr Pepper combined market share of the soft drink market is above 90%.

1690523576952

Source: Genuine impact

Disclaimer

This marketing document has been issued by Bank Syz Ltd. It is not intended for distribution to, publication, provision or use by individuals or legal entities that are citizens of or reside in a state, country or jurisdiction in which applicable laws and regulations prohibit its distribution, publication, provision or use. It is not directed to any person or entity to whom it would be illegal to send such marketing material. This document is intended for informational purposes only and should not be construed as an offer, solicitation or recommendation for the subscription, purchase, sale or safekeeping of any security or financial instrument or for the engagement in any other transaction, as the provision of any investment advice or service, or as a contractual document. Nothing in this document constitutes an investment, legal, tax or accounting advice or a representation that any investment or strategy is suitable or appropriate for an investor's particular and individual circumstances, nor does it constitute a personalized investment advice for any investor. This document reflects the information, opinions and comments of Bank Syz Ltd. as of the date of its publication, which are subject to change without notice. The opinions and comments of the authors in this document reflect their current views and may not coincide with those of other Syz Group entities or third parties, which may have reached different conclusions. The market valuations, terms and calculations contained herein are estimates only. The information provided comes from sources deemed reliable, but Bank Syz Ltd. does not guarantee its completeness, accuracy, reliability and actuality. Past performance gives no indication of nor guarantees current or future results. Bank Syz Ltd. accepts no liability for any loss arising from the use of this document.
Read More

Straight from the Desk

Syz the moment

Live feeds, charts, breaking stories, all day long.

Thinking out loud

Sign up for our weekly email highlighting the most popular posts.

Follow us

Thinking out loud

Investing with intelligence

Our latest research, commentary and market outlooks