Charles-Henry Monchau

Chief Investment Officer

pdf

Chart #1 — 

US inflation picks up slightly in July 

It was the most eagerly awaited figure of the week, that of US inflation in July. Headline CPI accelerated to 3.2% year-on-year, up from 3% in June and slightly below consensus expectations (3.3%). This is the first acceleration after twelve consecutive months of decline. Year-on-year goods inflation slowed in July, while services inflation remained very high at 6.1%. 
Core inflation, i.e., excluding food and energy, slowed to 4.7% year-on-year  from 4.8% in June, in line with expectations. It should be noted that housing costs contributed around 90% of the core inflation rate in July.

As for the Fed's preferred inflation indicator, the CPI excluding energy, food and housing, it remains well above the Fed's target. It even accelerated again in July (0.2% sequentially and 4.0% year-on-year vs. 3.9% in June). 

Following this publication, the short interest rate group attributes only a low probability (20%) to a further increase in the key rate at the US Federal Reserve's September meeting. 
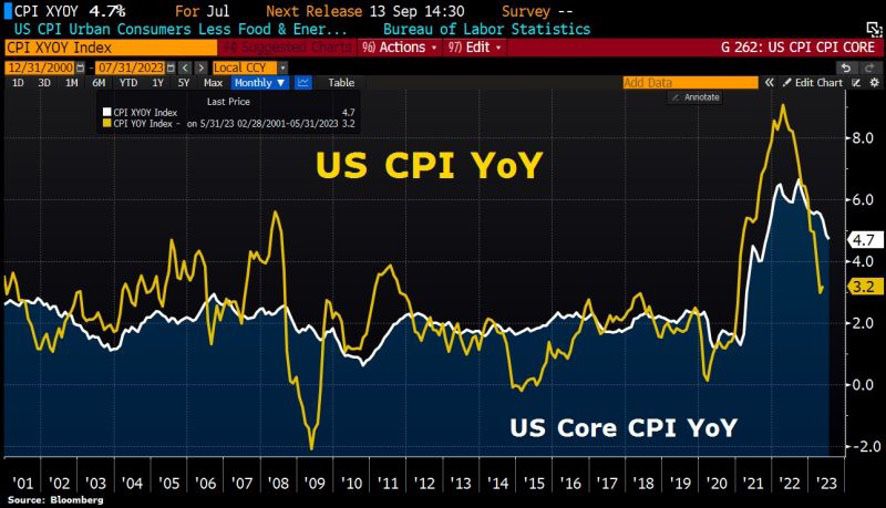
 

pic1

Source: Bloomberg


Chart #2 — 

Despite the recent consolidation, equity market valuation multiples remain on the high side

The US equity indices ended the week on a low note, with the recent rise in bond yields continuing to weigh on investor sentiment. The Dow Jones posted a modest gain, while the Nasdaq was down (-2%) for the second week running. Despite this consolidation, US equities are still not cheap when measured by key valuation ratios.

As the table below shows, these ratios are all in the red, indicating that they have risen above their long-term median. Europe looks slightly overvalued, while the UK and emerging markets have valuation ratios below their fair value.

pic 2-Aug-15-2023-08-19-14-3377-AM

Source: Schroders


Chart #3 — 

Nvidia vs. Cisco Systems

This is the stock with the highest valuation ratios among the very large market capitalizations. Nvidia ($NVDA) is currently trading at 41 times its sales over the last 12 months.

It is interesting to note that in 2000, Cisco ($CSCO), which was the darling of investors and the media at the time, was trading at 38 times sales. Cisco's share price today is lower than it was at the turn of the century.

pic 3-Aug-15-2023-08-21-37-0807-AM

Source :Barchart


Chart #4 — 

Ferrari, the power of scarcity


Some luxury car brands have the privilege of being able to set very high prices and thus benefit from relatively high gross margins. This is the case, for example, of the Ferrari group, which manages to maintain a gross margin close to 50% whatever the phase of the economic cycle.

At the recent Ferrari Group results conference call ($RACE), the CEO gave the following answer to the question of how many cars the Ferrari Group plans to produce: "I understand that these figures arouse a lot of curiosity. What I can tell you is that we will always sell one car less than market demand.

pic 4-Aug-15-2023-08-24-28-4409-AM

Source: Quartr


Chart #5 — 

Interest on US federal government debt exceeds $1 trillion   


At the beginning of August, Fitch downgraded the long-term debt rating of the United States from AAA to AA+. Although Jamie Dimon (CEO of JP Morgan) and Janet Yellen (head of the US Treasury) have expressed their disagreement with this decision, certain figures seem to indicate that Fitch's downgrade of Uncle Sam's rating is not entirely unjustified.

US debt levels are set to rise from 98% of GDP in 2023 to 118% of GDP in 2033. By 2053, the US debt-to-GDP ratio is expected to reach an alarming 195% (source: CBO). Meanwhile, US interest costs have risen by around 50% over the past year, to almost $1 trillion on an annual basis. 

pic 5-Aug-15-2023-08-25-41-1265-AM


Chart #6 — 

The debt/GDP ratios of the US and Switzerland are moving in opposite directions 


In 2001, article 126 of the Swiss Constitution codified a structural budget balance rule for the federal government, known as the "debt brake". The debt brake was designed to prevent structural deficits leading to an increase in debt, as happened in Switzerland in the 1990s. 

The constitutional provision was introduced in 2003 and since the Swiss public debt as a percentage of GDP has, as if by magic, fallen almost uninterruptedly (see the red line in the graph below). To make the federal government fiscally responsible, it created the debt ceiling , a limit imposed by Congress on the amount the federal government can borrow. But the ceiling can be raised under certain conditions. Since 1960, Congress has raised the ceiling 78 times, raising questions about the effectiveness of this tool in ensuring fiscal responsibility.

The result of  these different policies can be seen clearly in the graph: the United States (blue line) has reached record levels of indebtedness over time. And this trend is unlikely to be reversed any time soon.

pic 6-Aug-15-2023-08-27-04-6255-AM

Source: IMF, Costa Vayenas


Chart #7 — 

Who will still be buying Russian fossil fuels in 2023?   


While Russia's revenues from fossil fuel exports have fallen considerably since peaking in March 2022, many countries continue to import millions of dollars a day of raw materials from Russia.

China remains Russia's largest buyer of fossil fuels, with imports reaching $30 billion in 2023 to 16 June 2023. Nearly 80% of China's fuel imports are crude oil. Russia's average daily revenue from Chinese fossil fuel imports has fallen from $210 million in 2022 to $178 million in 2023, largely due to the fall in the price of Russian crude oil.

China is followed by the which, although stopped importing coal from Russia in August 2022, still import $18.4 billion worth of fossil fuels, split 60/40 between crude oil and natural gas respectively. After China and the EU bloc, India is the second largest importer of Russian fossil fuels, having increased its fossil fuel imports more than 10-fold since before Russia's invasion of Ukraine, largely due to lower Russian oil prices. Turkey is the only other country to have imported more than $10 billion worth of Russian fossil fuels in 2023, with all other countries having imported less than $3 billion this year.

pic 7-Aug-15-2023-08-29-01-1952-AM

Source:Elements, Visual Capitalist

Disclaimer

This marketing document has been issued by Bank Syz Ltd. It is not intended for distribution to, publication, provision or use by individuals or legal entities that are citizens of or reside in a state, country or jurisdiction in which applicable laws and regulations prohibit its distribution, publication, provision or use. It is not directed to any person or entity to whom it would be illegal to send such marketing material. This document is intended for informational purposes only and should not be construed as an offer, solicitation or recommendation for the subscription, purchase, sale or safekeeping of any security or financial instrument or for the engagement in any other transaction, as the provision of any investment advice or service, or as a contractual document. Nothing in this document constitutes an investment, legal, tax or accounting advice or a representation that any investment or strategy is suitable or appropriate for an investor's particular and individual circumstances, nor does it constitute a personalized investment advice for any investor. This document reflects the information, opinions and comments of Bank Syz Ltd. as of the date of its publication, which are subject to change without notice. The opinions and comments of the authors in this document reflect their current views and may not coincide with those of other Syz Group entities or third parties, which may have reached different conclusions. The market valuations, terms and calculations contained herein are estimates only. The information provided comes from sources deemed reliable, but Bank Syz Ltd. does not guarantee its completeness, accuracy, reliability and actuality. Past performance gives no indication of nor guarantees current or future results. Bank Syz Ltd. accepts no liability for any loss arising from the use of this document.

Read More

Straight from the Desk

Syz the moment

Live feeds, charts, breaking stories, all day long.

Thinking out loud

Sign up for our weekly email highlighting the most popular posts.

Follow us

Thinking out loud

Investing with intelligence

Our latest research, commentary and market outlooks