Charles-Henry Monchau

Chief Investment Officer

Chart #1 — 

US inflation appears to be accelerating again


It was the week's most anticipated figure: US March inflation. The figures surprised most economists by coming in above expectations.

The headline inflation rate was 3.5% year-on-year, compared with the consensus figure of 3.4%. As a reminder, the inflation rate was 3.2% in February. This is the 3rd consecutive month of rising inflation...and the highest since September 2023.

Core inflation, i.e., excluding food and energy, also exceeded estimates: +3.8% year-on-year versus 3.7% expected and 3.76% in February. This is the first increase in core inflation since March 2023. Transport prices rose by +10.7% year-on-year and housing by +5.7%.

As for the "Supercore" index (i.e., excluding food, energy, and housing), it rose by +0.65% sequentially and 4.77% year-on-year. This is the highest rate in 11 months.

The U.S. Federal Reserve and its Chairman Jerome Powell probably didn't appreciate this new series of indicators. These statistics seem to push back the date at which the Fed could lower its key rates even further. Market estimates of the number of rate cuts expected in 2024 have been revised downwards, and a first cut in June is looking less and less likely. The scenario of no Fed rate cut in 2024 is becoming more likely. Indeed, the risk of a 2nd wave of inflation, like that seen in the 70s and 80s, is now being taken very seriously by economists
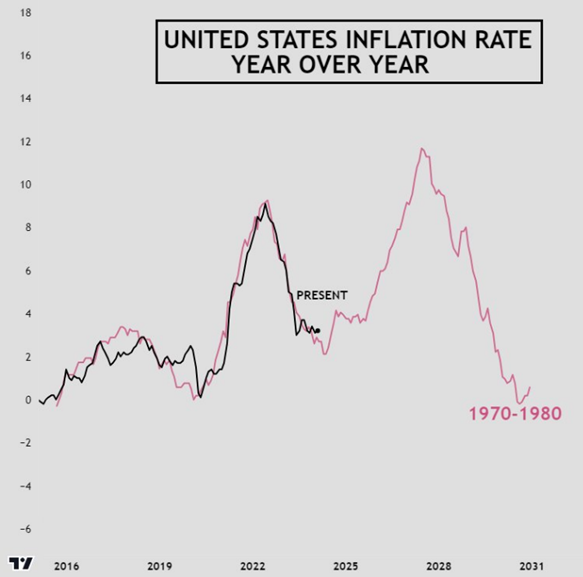
Source: TradingView


Chart #2  — 

The resilience of the S&P 500

The performance of the S&P 500 index has been truly exceptional this year. The index is up 9% year-to-date, more than DOUBLE the average performance of an election year. In the past, the median performance for such a year was around 11%. There are still several months to go before the presidential election, but the index is on track to significantly exceed its historical performance.

Source:  The Kobeissi Letter


Chart #3  — 

FAANGs have their vaults full of cash

The major tech companies are flush with cash: Alphabet has almost $100 billion on its balance sheet, Apple nearly $65 billion, and Meta $45 billion. This should facilitate share buybacks in the months ahead.

Source: WSJ


Chart #4 — 

The importance of share buybacks for the S&P 500

As far as share buybacks by US companies are concerned, we are currently in the "blackout" period: in the weeks leading up to the publication of quarterly results, companies are not authorised to proceed with share buybacks (or issues). This is a major drag on the markets, as buybacks account for a very large proportion of demand. Since 2000, US companies have been by far the biggest buyers of US equities, with net purchases reaching 5,500 billion over the period. This far exceeds all other sources of demand.

Source: Goldman Sachs, David Marlin


Chart #5 — 

U.S. federal debt could reach $40,000 billion by 2025


U.S. federal debt is set to double in just 8 years, from $20,000 billion in 2017 to $40,000 billion in 2025.

Currently, US federal debt increases by $1,000 billion every 100 days. To put this in perspective, if US debt reaches $40,000 billion in 2025, this would represent an increase of $17,000 billion since 2020. That’s a ~570% jump in US federal debt since 2000, a period of 25 years. And this analysis assumes we're on track for a "soft landing" of the economy. What will happen in the event of a recession?

Source : BofA, Kobeissi Letter


Chart  #6 — 

Central banks with the largest gold holdings

The chart below shows gold purchases by central banks in recent years. China is clearly in the lead, with purchases accelerating in 2023. With gold having just exceeded $2,400 an ounce, it is highly likely that central banks will continue to accumulate the precious metal.

Source: BofA


Chart #7 — 

The acquisitions strategy of Richemont, one of the three giants of the luxury goods industry

In 1987, Bernard Arnault created LVMH. In 1988, Johann Rupert created Richemont, a luxury group focused on acquisitions, like LVMH. The infographic below traces all the acquisitions made by Richemont since its creation.

Today, Richemont is the world's second-largest luxury conglomerate and third-largest luxury company (2nd place is held by Hermès).

The group's many prestigious houses include Cartier, Van Cleef & Arpels, Montblanc, Piaget and Vacheron Constantin, to name but a few.

Since its creation, Richemont has increased its sales by 5% a year. Over the past 15 years, the Group has increased its revenues and Free-Cash-Flow at an average annual growth rate (CAGR) of 6% and 9% respectively.

Source: Quartr


Disclaimer

This marketing document has been issued by Bank Syz Ltd. It is not intended for distribution to, publication, provision or use by individuals or legal entities that are citizens of or reside in a state, country or jurisdiction in which applicable laws and regulations prohibit its distribution, publication, provision or use. It is not directed to any person or entity to whom it would be illegal to send such marketing material. This document is intended for informational purposes only and should not be construed as an offer, solicitation or recommendation for the subscription, purchase, sale or safekeeping of any security or financial instrument or for the engagement in any other transaction, as the provision of any investment advice or service, or as a contractual document. Nothing in this document constitutes an investment, legal, tax or accounting advice or a representation that any investment or strategy is suitable or appropriate for an investor's particular and individual circumstances, nor does it constitute a personalized investment advice for any investor. This document reflects the information, opinions and comments of Bank Syz Ltd. as of the date of its publication, which are subject to change without notice. The opinions and comments of the authors in this document reflect their current views and may not coincide with those of other Syz Group entities or third parties, which may have reached different conclusions. The market valuations, terms and calculations contained herein are estimates only. The information provided comes from sources deemed reliable, but Bank Syz Ltd. does not guarantee its completeness, accuracy, reliability and actuality. Past performance gives no indication of nor guarantees current or future results. Bank Syz Ltd. accepts no liability for any loss arising from the use of this document.

Read More

Straight from the Desk

Syz the moment

Live feeds, charts, breaking stories, all day long.

Thinking out loud

Sign up for our weekly email highlighting the most popular posts.

Follow us

Thinking out loud

Investing with intelligence

Our latest research, commentary and market outlooks