Charles-Henry Monchau

Chief Investment Officer

Chart #1 — 

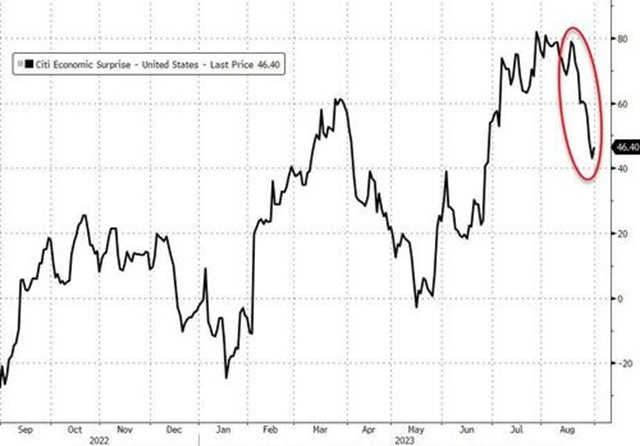
Disappointing macroeconomic data from the US  

After several months of positive surprises in US macroeconomic data, August was rather disappointing, with the Citigroup Economic Surprises Index falling by the most since May 2022.It should be noted, however, that most of the negative surprises came from hard data, i.e. macroeconomic data for the past month.

The 'soft data' - which attempts to estimate future data - mostly surprised on the upside. For example, the Atlanta Fed's Nowcast GDP model estimates that US real GDP for the 3rd quarter could be 5.9% annualised. This growth rate is well above market expectations.

Picture1-Sep-04-2023-01-45-55-9930-PM

Source: Bloomberg


Chart #2 — 

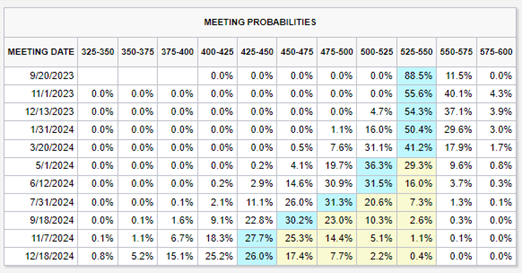
Market revises US interest rate outlook upwards

Despite disappointing US macroeconomic data overall, the market has revised upwards its rate hike expectations. At 31 August, the market was expecting a 12% probability of a Fed rate hike in September and a 45% probability of a hike in November or December. However, it would appear that the market consensus is converging on the scenario of a long pause in the interest rate cycle.

This scenario was corroborated by Mr Powell's speech at the eagerly awaited central bankers' symposium in Jackson Hole, Wyoming, at the end of the month. The main message is that the Fed is ready to take a pause in its monetary policy, but that it will adopt a more hawkish stance if the economic data continue to be so robust.

Picture2-Sep-04-2023-01-48-11-2532-PM

Source:  The Kobeissi Letter


Chart #3 — 

Fears of a serious property and financial crisis in China

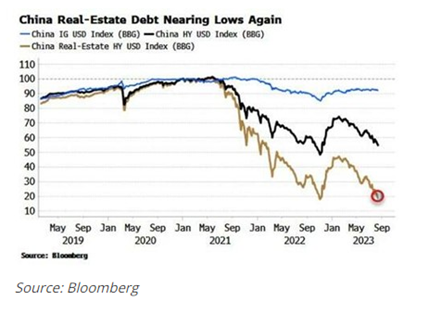
China is currently facing a whole series of problems: a crisis of confidence, risks linked to the shadow banking system, the inability of the private sector to stimulate growth, record youth unemployment and, above all, a crisis in the property sector. The long-term fundamentals of the housing market have changed: China's population growth has probably peaked, urbanisation is slowing and the rate of home ownership is already very high. This means that property demand and construction will remain well below the peaks reached in 2020-2021, even if they recover from their lows. In the meantime, the sector remains under intense pressure and threatens China's economic and financial stability.

Country Garden, China's largest property developer, is in danger of defaulting, with billions of dollars in losses and $200 billion in unpaid bills. Meanwhile, Evergrande has filed for Chapter 15 bankruptcy protection in a Manhattan court. In July, Evergrande posted a combined loss of $81 billion over the past two years. Complicating China's property problem is the fact that China's state-owned property developers are also in deep trouble, reducing their ability to support the sector by taking over unfinished projects from the private sector. As a result, the real estate index for Investment Grade and High Yield debt in China's property sector is close to historic lows.

Picture3-Sep-04-2023-01-50-21-0954-PM

Source: Boomberg 


Chart #4 — 

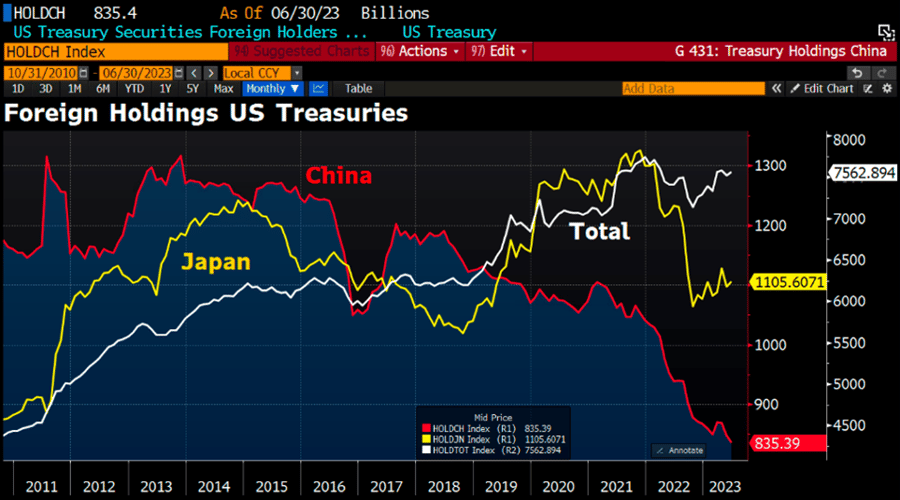
Weakening foreign demand for US Treasury bonds

These are tricky times for US sovereign debt, which is facing multiple headwinds: rising energy prices, quantitative tightening by the Fed and, finally, weakening demand from historic buyers of US Treasuries. Indeed, China's holdings of US Treasuries have just hit their lowest level in 14 years, falling below $850 billion; Saudi Arabia's stock of US Treasuries has fallen to its lowest level in over six years (at less than $100 billion), while Japanese investors - the largest foreign holders of US Treasuries - are now less interested in US bonds due to the rise in yields on long-term Japanese bonds following the Bank of Japan's adjustment of monetary policy.

This drop in demand is very bad news for Uncle Sam. Indeed, US interest costs have risen by around 50% over the past year, to almost USD 1,000 billion on an annual basis.

It also comes at a time when the supply of US Treasury securities is very high. As the budget deficit explodes, the US Treasury will sell $1,000 billion of debt this quarter, the second highest amount in history (only the $2,753 billion linked to Covid in the second quarter of 2020 exceeds it) - and a further $852 billion is expected in the fourth quarter. Total US debt levels are expected to rise from 98% of GDP in 2023 to 118% of GDP in 2033. By 2053, the US debt-to-GDP ratio is expected to reach an alarming 195% (CBO). Fitch's downgrade, while not immediately catastrophic, is a warning of the potential repercussions of rising indebtedness and lack of fiscal discipline.

While yields are looking increasingly attractive on the intermediate and long ends of the US yield curve, investors are well aware of the weak fundamentals and may demand a higher premium to invest in Treasuries in the future.

Picture4-Sep-04-2023-01-54-52-4935-PM

Source: Bloomberg


Chart #5 — 

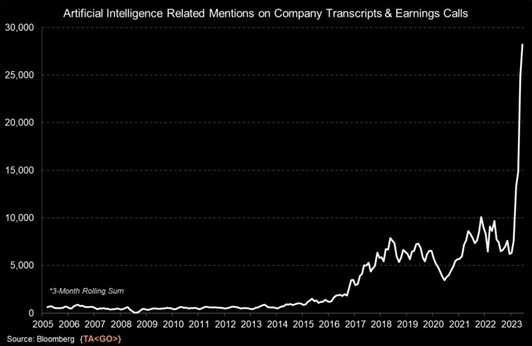
A fairly positive corporate results season, with AI as the guest star

A large majority of S&P stocks beat consensus expectations for Q2. It is also interesting to note that during July and August, analysts raised their EPS estimates for S&P 500 companies for the third quarter (+0.4%) and also for the fourth quarter (+0.6%). Artificial intelligence continues to create a buzz during the conference calls that follow the presentation of results. As the graph below shows, mentions of 'AI' in post-earnings conference calls, went from ~500 mentions in 2015 to ~30,000 this year, with 4 months still to go. Companies seem to want to 'surf' on the hype generated by artificial intelligence among investors.

Picture5-Sep-04-2023-02-02-22-9433-PM

Source: Bloomberg, The Kobeissi Letter


Chart #6 — 

Simultaneous correction in US equity and bond markets


Despite upward revisions to corporate earnings expectations, market volatility increased in August, reflecting renewed tension in the Chinese property market, weak macroeconomic data from China and rising sovereign bond yields in the United States.

Against this backdrop, global equities fell over the month (-2.8% for the MSCI All Country World index). Developed markets fared better than emerging markets, losing 2.3% compared with 6.1%.

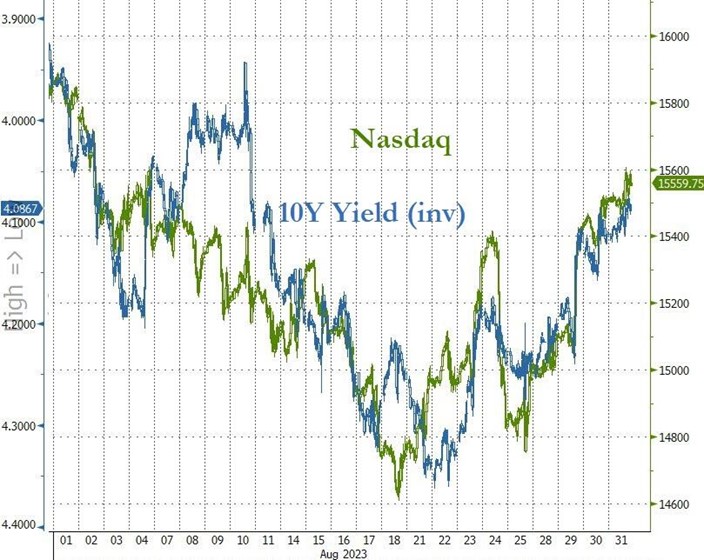
Despite a rebound at the end of the month, US equities were also down in August. The Nasdaq recorded its worst monthly performance (-2.1%) since December 2022. The S&P 500 fell by -1.6%. As the chart below shows, there is a strong correlation between movements in the S&P 500 and those in 10-year US Treasury yields.

Picture6-Sep-04-2023-02-05-06-7488-PM

Source: Bloomberg


Chart #7 — 

Energy stocks gained, banking stocks dumped

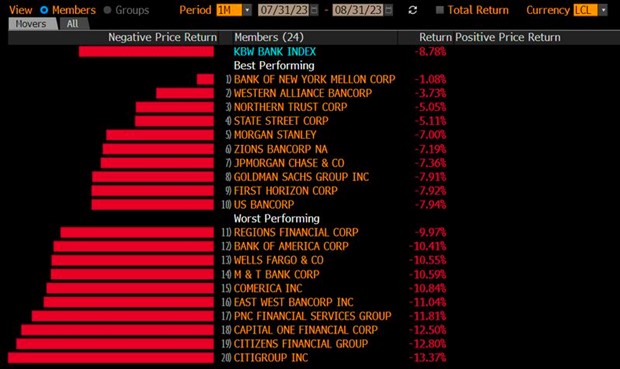
With the rebound in oil, the energy sector (S&P 500) posted a gain of 1.5% in August. It was the only sector to post a positive performance. The worst performer was the utilities sector (-5.9%), which is highly sensitive to bond yields. The banking sector also had a complicated month; US banks remain under pressure (-8.8% over the month) due to the rise in bond yields and the withdrawal of deposits by their customers in favour of money market funds.

Picture7-Sep-04-2023-02-06-40-9404-PM

Source: Bloomberg


Chart #8 — 

A strong month for the greenback

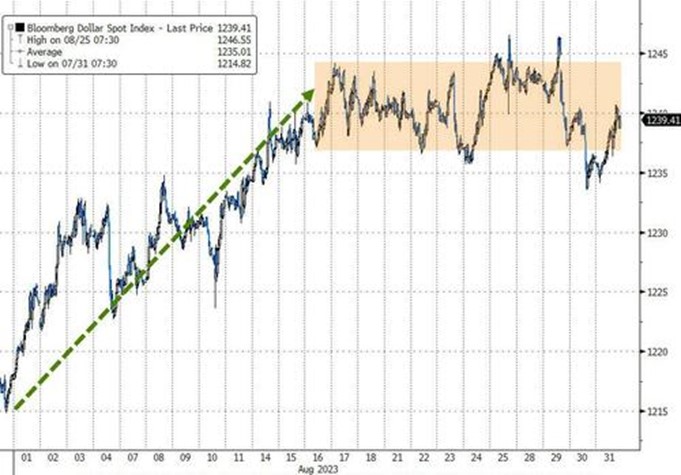
Fears about China, the Fed's still restrictive policy and relatively disappointing economic data from Europe enabled the US dollar to record its biggest monthly rise since February. Even if this rise occurred mainly in the first part of the month.

Picture8-3

Source: Bloomberg


Chart #9 — 

A mixed month for commodities

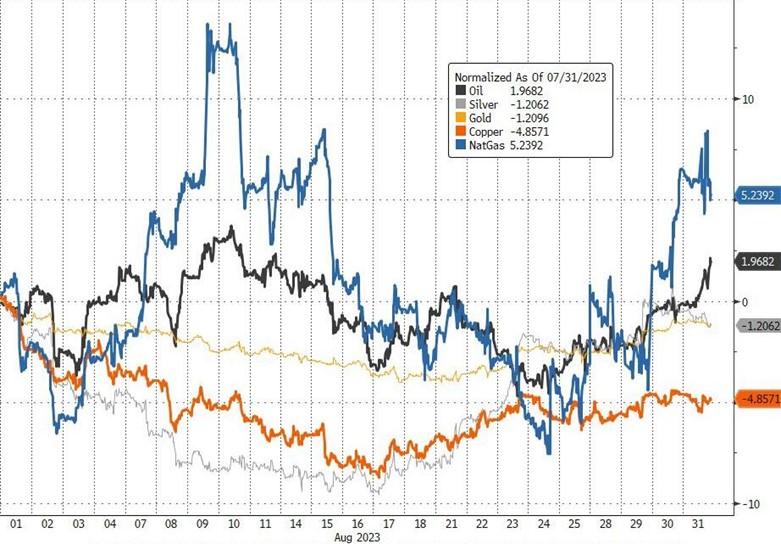
As a result of the rise in the greenback and China's difficulties, commodities were generally under pressure over the past month. Copper, gold and silver posted negative monthly performances. By contrast, energy continued to rebound, with gains of 5.2% for natural gas and 2% for oil.

Picture9-2


Chart #10  — 

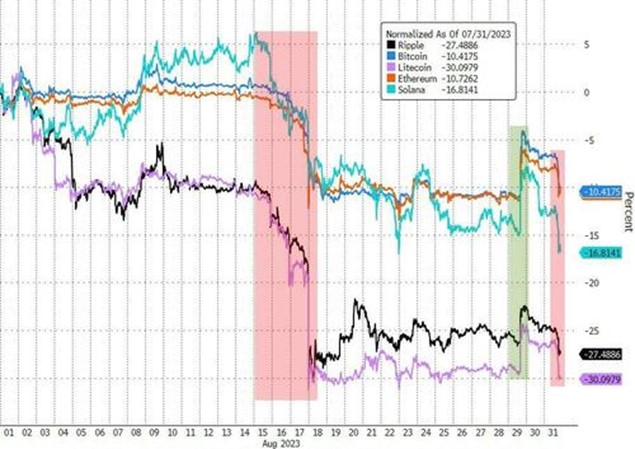
Cryptocurrencies lost their shine

While cryptocurrencies rebounded spectacularly in the first half of the year, Bitcoin and Ether were both down by almost 10% in August. Low market liquidity and rising bond yields appear to have weighed on this new asset class.

Picture10-4

Source: Bloomberg, www.zerohedge.com

Disclaimer

This marketing document has been issued by Bank Syz Ltd. It is not intended for distribution to, publication, provision or use by individuals or legal entities that are citizens of or reside in a state, country or jurisdiction in which applicable laws and regulations prohibit its distribution, publication, provision or use. It is not directed to any person or entity to whom it would be illegal to send such marketing material. This document is intended for informational purposes only and should not be construed as an offer, solicitation or recommendation for the subscription, purchase, sale or safekeeping of any security or financial instrument or for the engagement in any other transaction, as the provision of any investment advice or service, or as a contractual document. Nothing in this document constitutes an investment, legal, tax or accounting advice or a representation that any investment or strategy is suitable or appropriate for an investor's particular and individual circumstances, nor does it constitute a personalized investment advice for any investor. This document reflects the information, opinions and comments of Bank Syz Ltd. as of the date of its publication, which are subject to change without notice. The opinions and comments of the authors in this document reflect their current views and may not coincide with those of other Syz Group entities or third parties, which may have reached different conclusions. The market valuations, terms and calculations contained herein are estimates only. The information provided comes from sources deemed reliable, but Bank Syz Ltd. does not guarantee its completeness, accuracy, reliability and actuality. Past performance gives no indication of nor guarantees current or future results. Bank Syz Ltd. accepts no liability for any loss arising from the use of this document.
Read More

Straight from the Desk

Syz the moment

Live feeds, charts, breaking stories, all day long.

Thinking out loud

Sign up for our weekly email highlighting the most popular posts.

Follow us

Thinking out loud

Investing with intelligence

Our latest research, commentary and market outlooks