
.png)
Source: Bloomberg
We are sorry that for legal reasons we are not able to help US citizens or Canadian residents other than in Ontario, Quebec, or Alberta. Best wishes for the future…
We are sorry that for legal reasons we are not able to help US citizens or Canadian residents other than in Ontario, Quebec, or Alberta. Best wishes for the future…
You chose the following profile. If you made a mistake, please change here USA
This marketing document has been issued by Bank Syz Ltd. It is not intended for distribution to, publication, provision or use by individuals or legal entities that are citizens of or reside in a state, country or jurisdiction in which applicable laws and regulations prohibit its distribution, publication, provision or use. It is not directed to any person or entity to whom it would be illegal to send such marketing material.
This document is intended for informational purposes only and should not be construed as an offer, solicitation or recommendation for the subscription, purchase, sale or safekeeping of any security or financial instrument or for the engagement in any other transaction, as the provision of any investment advice or service, or as a contractual document. Nothing in this document constitutes an investment, legal, tax or accounting advice or a representation that any investment or strategy is suitable or appropriate for an investor's particular and individual circumstances, nor does it constitute a personalized investment advice for any investor.
This document reflects the information, opinions and comments of Bank Syz Ltd. as of the date of its publication, which are subject to change without notice. The opinions and comments of the authors in this document reflect their current views and may not coincide with those of other
Syz Group entities or third parties, which may have reached different conclusions. The market valuations, terms and calculations contained herein are estimates only. The information provided comes from sources deemed reliable, but Bank Syz Ltd. does not guarantee its completeness, accuracy, reliability and actuality. Past performance gives no indication of nor guarantees current or future results. Bank Syz Ltd. accepts no liability for any loss arising from the use of this document.

Charles-Henry Monchau
Chief Investment Officer
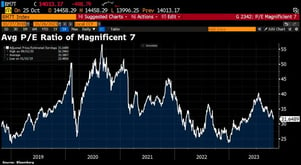
The Nasdaq 100 is down 11% on its July peak, meaning that the big tech companies are now in correction territory, a 20% drop corresponds to a bear market. As the chart below shows, the average price/earnings (P/E) multiple of the Magnificent 7 (Tesla, Apple, Amazon, Meta, Microsoft, Alphabet and Nvidia) has fallen significantly. It seems that the artificial intelligence bubble is deflating…
Source: Bloomberg
According to Factset, while 146 S&P 500 companies have already published their figures for Q3 2023, 80% of them have beaten analysts' earnings expectations and 60% have reported sales above expectations. Pessimism comes more from market reaction. When companies beat analysts' expectations, the median performance (orange bar) is slightly negative. And when companies report results below expectations (white bar), the median performance is clearly negative. The latter is the worst median market reaction in four years. We note that company executives regularly express doubts about the strength of earnings growth in 2024. Indeed, a majority of executives fear a sharp slowdown in global growth next year, with major consequences for their business volumes.
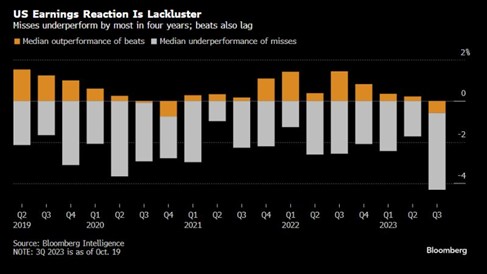
Source: Bloomberg
The shares of four of Wall Street's biggest banks are currently under severe pressure, with their share prices returning to the lows reached during the banking crisis in March. The declines since the start of the year are now very substantial, fluctuating between -15% and -24%, which is causing great concern among investors and the market as a whole. The reasons cited for this downturn are manifold: deteriorating consumer and corporate prospects, large unrealized losses on bond portfolios held by banks, weak trading activity, and a sharp decline in trading and M&A activity.
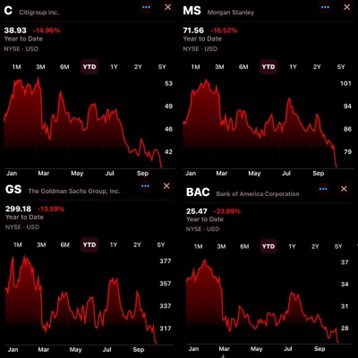
Source: The Coastal Journal
While ChatGPT is to some extent free to use, the valuation of its parent company OpenAI is far from cheap. The company is currently in talks to sell a portion of its shares on the basis of a valuation of $86 billion, a capitalization three times higher than that prevailing just six months ago (source: Wall Street Journal). This amount would place OpenAI among the world's best-valued technology startups, just behind giants such as ByteDance (owner of TikTok) and SpaceX. To give an order of magnitude, this valuation is equivalent to the market capitalization of 12 of America's biggest consumer brands combined - a theoretical corporate frankenstein including SNAP, The New York Times, Etsy, Domino's and 8 others.
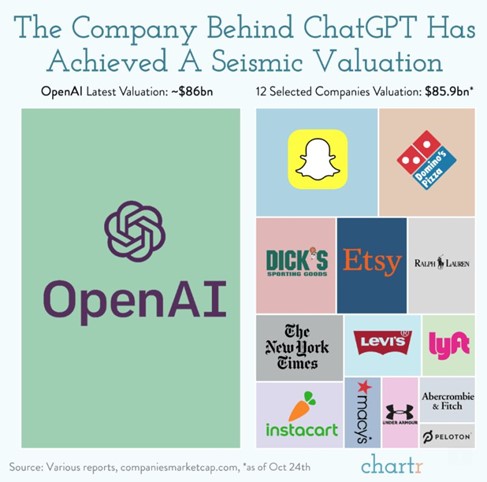
Source: Chartr
On Friday October 20, S&P Global Ratings upgraded Greece's debt rating from BB+/B to BBB./A-3, placing it in the "investment grade" category instead of the "speculative grade" category - for the first time since 2010. Whereas Greek debt was once a financial market pariah, a healthier economy and the end of the European Commission's trusteeship justifies Greece's return to the investment grade category. It is worth noting that yields to maturity on Greek 10-year bonds are now well below those of US Treasury yields. At the height of the Greek crisis, Greek yields were 17% higher than US yields...
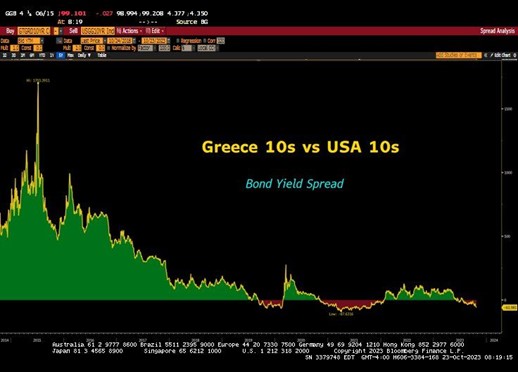
Source: Bloomberg
Japan is in some ways a precursor to quantitative easing (QE) and its associated excesses. With the country of the rising sun facing record indebtedness (debt reached 260% of GDP), Japan's central bank practiced what is known as Yield Curve Control YCC (YCC Yield curve control), i.e. buying massive quantities of Japanese debt to keep bond yields as low as possible, and to ensure that borrowing costs were not prohibitive for the Japanese budget. This monetary policy remains in place despite the recent rise in Japanese inflation. As a result, the yen continues to depreciate against other currencies. The Japanese currency is also depreciating in real terms. As the chart below shows, gold expressed in yen is appreciating exponentially. While other major developed countries (USA, Europe) seem to be following in Japan's footsteps, could the precious metal follow a similar trajectory in dollars or euros?
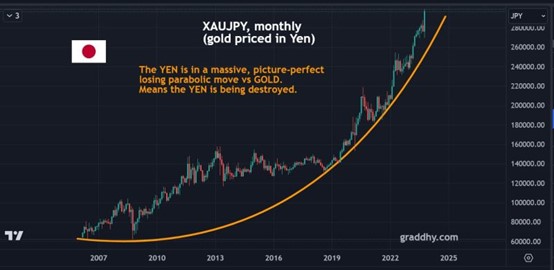
Source: Bloomberg
Fears of World War 3, hopes of SEC approval for a Blackrock spot bitcoin ETF and hedging moves by short sellers have propelled bitcoin well above $30,000. After the crash of 2022, bitcoin has more than doubled this year. It is currently the best-performing asset class in 2023.
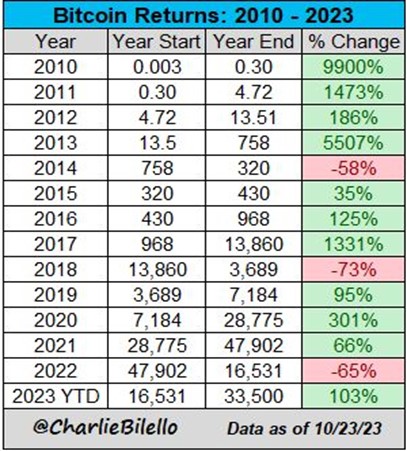
Source: Charlie Bilello
This marketing document has been issued by Bank Syz Ltd. It is not intended for distribution to, publication, provision or use by individuals or legal entities that are citizens of or reside in a state, country or jurisdiction in which applicable laws and regulations prohibit its distribution, publication, provision or use. It is not directed to any person or entity to whom it would be illegal to send such marketing material. This document is intended for informational purposes only and should not be construed as an offer, solicitation or recommendation for the subscription, purchase, sale or safekeeping of any security or financial instrument or for the engagement in any other transaction, as the provision of any investment advice or service, or as a contractual document. Nothing in this document constitutes an investment, legal, tax or accounting advice or a representation that any investment or strategy is suitable or appropriate for an investor's particular and individual circumstances, nor does it constitute a personalized investment advice for any investor. This document reflects the information, opinions and comments of Bank Syz Ltd. as of the date of its publication, which are subject to change without notice. The opinions and comments of the authors in this document reflect their current views and may not coincide with those of other Syz Group entities or third parties, which may have reached different conclusions. The market valuations, terms and calculations contained herein are estimates only. The information provided comes from sources deemed reliable, but Bank Syz Ltd. does not guarantee its completeness, accuracy, reliability and actuality. Past performance gives no indication of nor guarantees current or future results. Bank Syz Ltd. accepts no liability for any loss arising from the use of this document.
Meanwhile, Wall Street's long-term earnings expectations for the S&P 500 are now at record levels. Each week, the Syz investment team takes you through the last seven days in seven charts.
Meanwhile, corporate leadership is evolving rapidly: only 135 of the S&P 500 constituents from 1996 are still in the index today, while the EU goods trade deficit with China is close to a record €376bn. Each week, the Syz investment team takes you through the last seven days in seven charts.
Meanwhile, Trump’s personal crypto earnings in 2025 topped the combined profits of every publicly listed US crypto company. Each week, the Syz investment team takes you through the last seven days in seven charts.
Live feeds, charts, breaking stories, all day long.
Our latest research, commentary and market outlooks