
.png)
Source: Bloomberg
We are sorry that for legal reasons we are not able to help US citizens or Canadian residents other than in Ontario, Quebec, or Alberta. Best wishes for the future…
We are sorry that for legal reasons we are not able to help US citizens or Canadian residents other than in Ontario, Quebec, or Alberta. Best wishes for the future…
You chose the following profile. If you made a mistake, please change here USA
This marketing document has been issued by Bank Syz Ltd. It is not intended for distribution to, publication, provision or use by individuals or legal entities that are citizens of or reside in a state, country or jurisdiction in which applicable laws and regulations prohibit its distribution, publication, provision or use. It is not directed to any person or entity to whom it would be illegal to send such marketing material.
This document is intended for informational purposes only and should not be construed as an offer, solicitation or recommendation for the subscription, purchase, sale or safekeeping of any security or financial instrument or for the engagement in any other transaction, as the provision of any investment advice or service, or as a contractual document. Nothing in this document constitutes an investment, legal, tax or accounting advice or a representation that any investment or strategy is suitable or appropriate for an investor's particular and individual circumstances, nor does it constitute a personalized investment advice for any investor.
This document reflects the information, opinions and comments of Bank Syz Ltd. as of the date of its publication, which are subject to change without notice. The opinions and comments of the authors in this document reflect their current views and may not coincide with those of other
Syz Group entities or third parties, which may have reached different conclusions. The market valuations, terms and calculations contained herein are estimates only. The information provided comes from sources deemed reliable, but Bank Syz Ltd. does not guarantee its completeness, accuracy, reliability and actuality. Past performance gives no indication of nor guarantees current or future results. Bank Syz Ltd. accepts no liability for any loss arising from the use of this document.

Charles-Henry Monchau
Chief Investment Officer
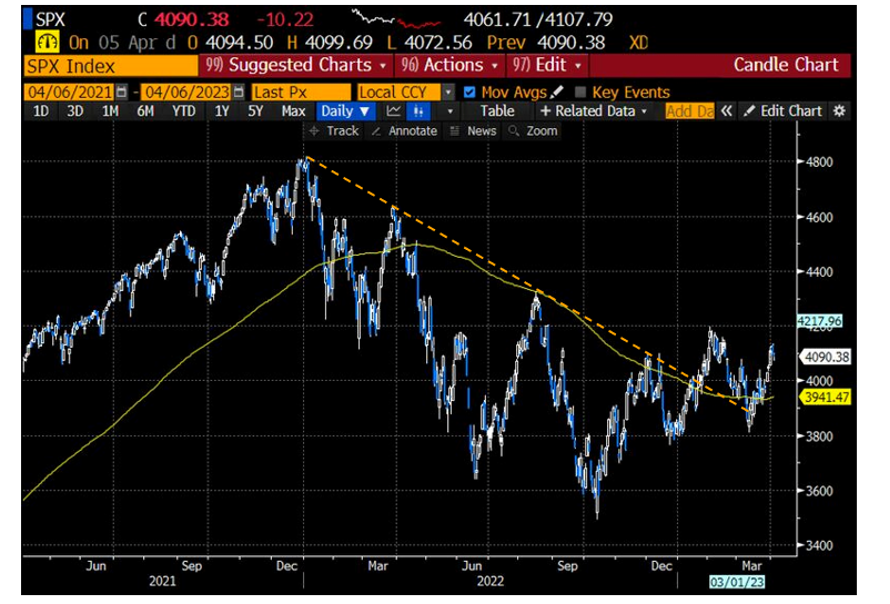
Since mid-March, the downtrend in the S&P 500 has been broken. We also note that the index is now trading above the 200-day moving average, which is actually changing direction (from bearish to bullish). Finally, the index continues to make higher lows.
Source: Bloomberg
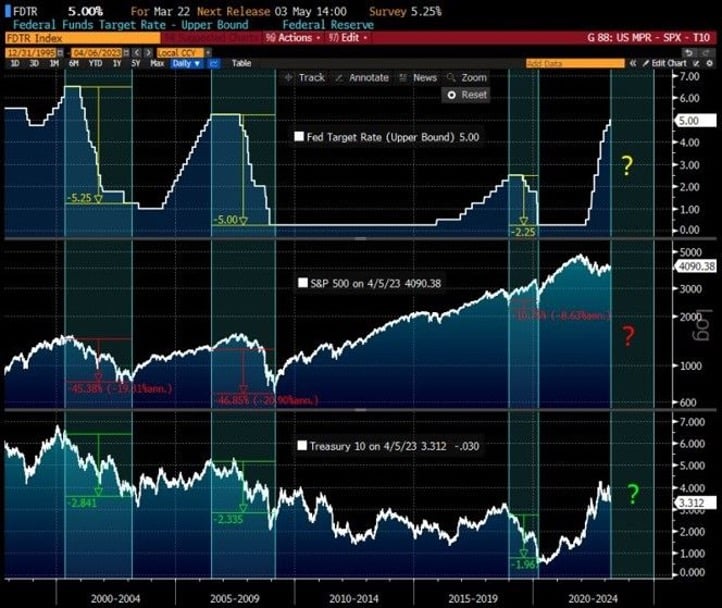
One of the current drivers for risky assets is the expectation of an imminent end to the Fed's rate hike cycle. But what exactly is the case? Do equity markets systematically appreciate once the Fed has made its last rate hike? Recent history suggests otherwise. As the chart below shows, the S&P 500 and 10-year bond yields have historically fallen once the Fed was done with monetary tightening (2001, 2008, 2018).
Source: Bloomberg
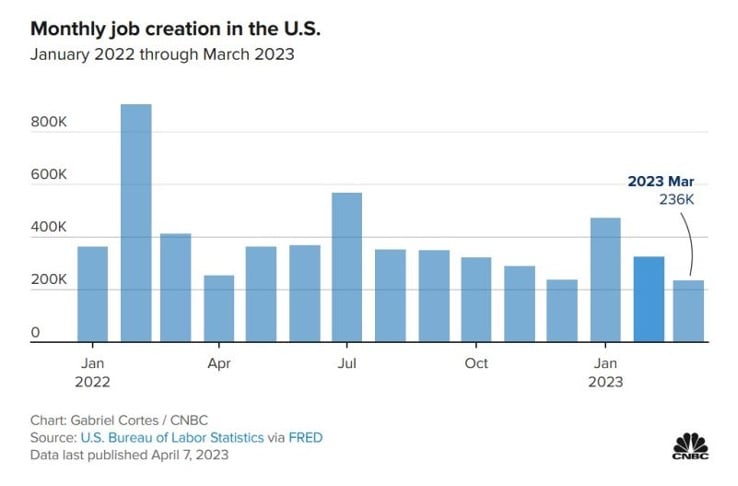
The U.S. Labor Department announced Friday that U.S. employment rose by 236,000 in March (see chart below), compared to a Dow Jones estimate of 238,000. The figure is lower than February's figure, which was revised upward to 326,000. The March jobs increase is the smallest since December 2020. It comes against a backdrop of monetary tightening by the Federal Reserve, which is aimed in part at slowing labor demand in order to lower the inflation rate.
While the total number of jobs was slightly higher than expected, this was mainly due to 47,000 government jobs. Private sector job creation was only 189,000, below consensus expectations (218,000) and also below February's 266,000.
The unemployment rate fell to 3.5 percent from an expected 3.6 percent. This decline was due to the labor force participation rate reaching its highest level since the covid. In fact, the participation rate increased from 62.5 percent to 62.6 percent.
The increase in payrolls was accompanied by a 0.3 percent increase in average hourly wages, bringing the 12-month increase to 4.2 percent, the lowest level since June 2021. However, this wage moderation is potentially explained by a slight decline in average hours worked from 34.5 to 34.4, below the expected 35.5.
Although the stock market is closed for Good Friday, S&P 500 futures rose following the release of the jobs report. Treasury yields also rose.
Source: CNBC
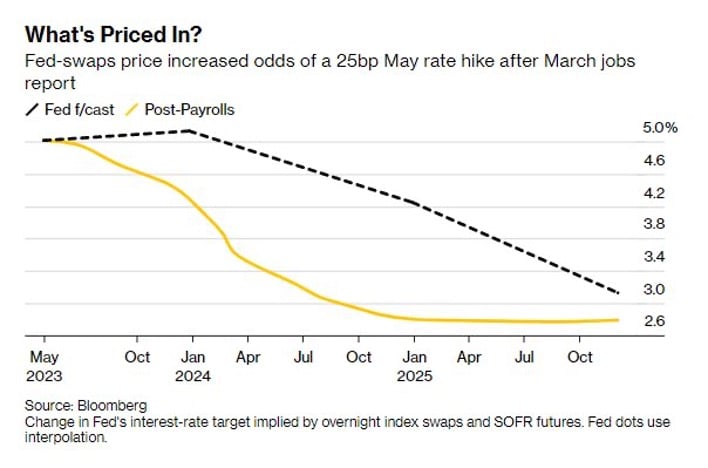
Following the release of the U.S. jobs report, the market now believes that the Fed will not pause at the May meeting, and that it will raise rates again (by 25 basis points to 5.00-5.25%). But the market also believes that this rate hike will be reversed as early as July with a 25 basis point drop to 4.75-5.00%.
Source: Bloomberg
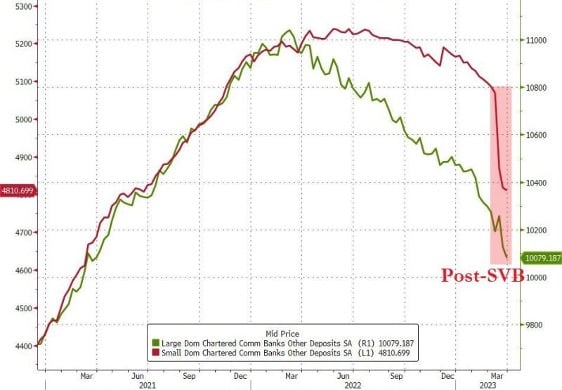
U.S. bank deposits fell for the tenth consecutive week, with small banks seeing their deposits fall by some $275 billion in March. Last week, both large and small banks saw outflows again, with $48 billion for large banks (deposits at the lowest since March 2021) and $7.2 billion for small banks (deposits at the lowest since June 2021).
Source: Bloomberg, www.zerohedge.com
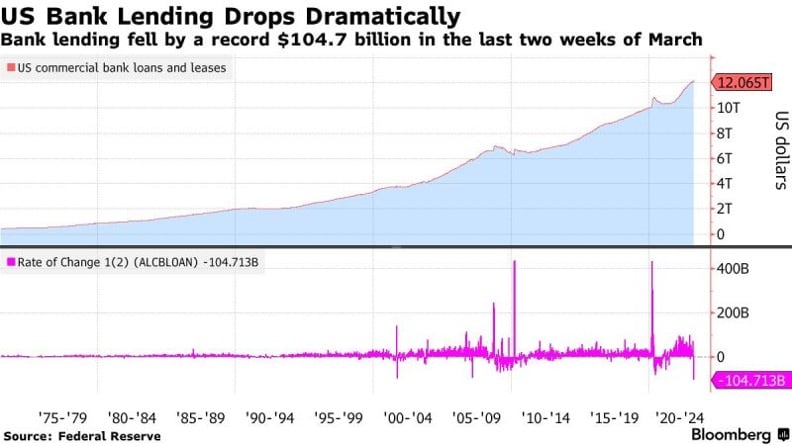
As a consequence of the sharp decline in deposits, lending by U.S. banks fell to a record low in March (-$104.7 billion). Tighter credit conditions should have a negative impact on US growth.
Source: Bloomberg, Fed
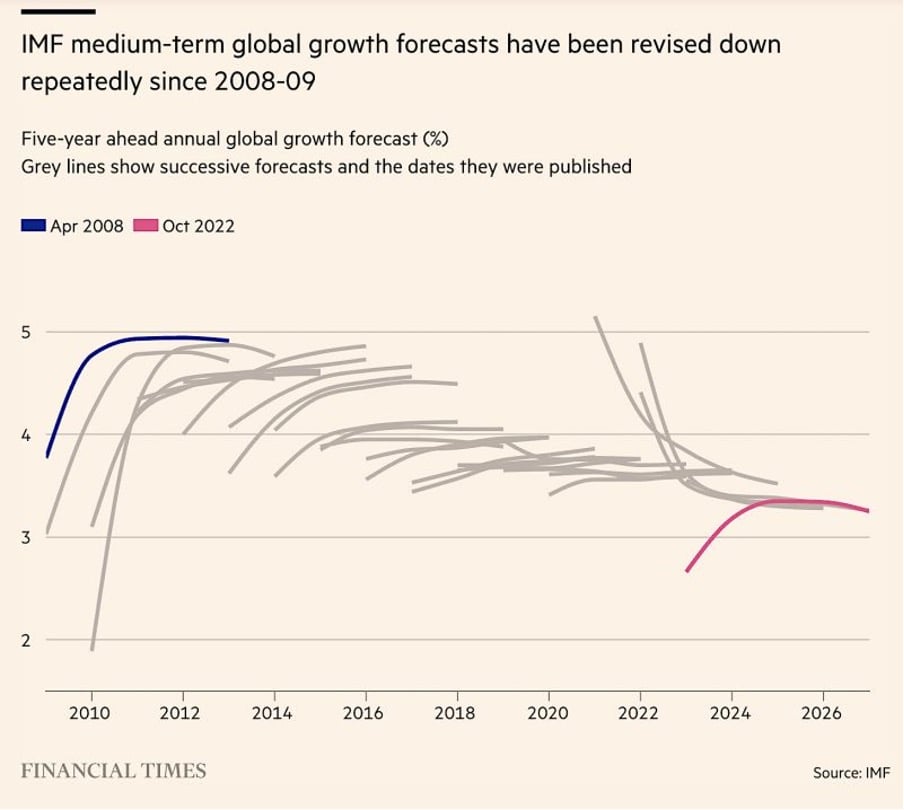
The global economy is poised for years of slow growth, warns IMF Director Kristalina Georgieva. The world economy is expected to grow at an average annual rate of about 3 percent over the next five years, well below the 3.8 percent average of the past two decades and the lowest medium-term growth projection since 1990. There is a silver lining, however: IMF forecasts are rarely right...
Source: HolgerZ, IMF
This marketing document has been issued by Bank Syz Ltd. It is not intended for distribution to, publication, provision or use by individuals or legal entities that are citizens of or reside in a state, country or jurisdiction in which applicable laws and regulations prohibit its distribution, publication, provision or use. It is not directed to any person or entity to whom it would be illegal to send such marketing material. This document is intended for informational purposes only and should not be construed as an offer, solicitation or recommendation for the subscription, purchase, sale or safekeeping of any security or financial instrument or for the engagement in any other transaction, as the provision of any investment advice or service, or as a contractual document. Nothing in this document constitutes an investment, legal, tax or accounting advice or a representation that any investment or strategy is suitable or appropriate for an investor's particular and individual circumstances, nor does it constitute a personalized investment advice for any investor. This document reflects the information, opinions and comments of Bank Syz Ltd. as of the date of its publication, which are subject to change without notice. The opinions and comments of the authors in this document reflect their current views and may not coincide with those of other Syz Group entities or third parties, which may have reached different conclusions. The market valuations, terms and calculations contained herein are estimates only. The information provided comes from sources deemed reliable, but Bank Syz Ltd. does not guarantee its completeness, accuracy, reliability and actuality. Past performance gives no indication of nor guarantees current or future results. Bank Syz Ltd. accepts no liability for any loss arising from the use of this document.
Meanwhile, Wall Street's long-term earnings expectations for the S&P 500 are now at record levels. Each week, the Syz investment team takes you through the last seven days in seven charts.
Meanwhile, corporate leadership is evolving rapidly: only 135 of the S&P 500 constituents from 1996 are still in the index today, while the EU goods trade deficit with China is close to a record €376bn. Each week, the Syz investment team takes you through the last seven days in seven charts.
Meanwhile, Trump’s personal crypto earnings in 2025 topped the combined profits of every publicly listed US crypto company. Each week, the Syz investment team takes you through the last seven days in seven charts.
Live feeds, charts, breaking stories, all day long.
Our latest research, commentary and market outlooks