Charles-Henry Monchau

Chief Investment Officer

Chart #1 — 

Another (slightly) positive week for US equities

The Dow Jones rose for the fourth week in a row. Despite signals of a slowing global economy, markets welcomed the deceleration in inflation figures (see next item). The first quarter earnings season kicked off on Friday with the release of figures from banking giants JP Morgan Chase, Wells Fargo and Citigroup. All three companies beat consensus estimates, which provided relief to investors. 
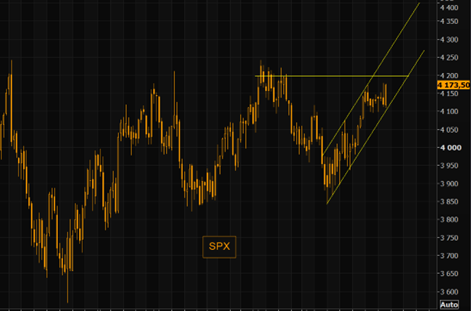
The S&P 500 continues to move in a bullish channel in place since the low point reached during the SBV bank debacle. The next resistance is at 4.200. A successful test of this resistance could force investors currently underinvested in stocks or net short to "chase the upside".

S&P 500 index chart

Picture1 - Copy

Source: Bloomberg, The Market Ear 


Chart #2 — 

US inflation continues to decelerate


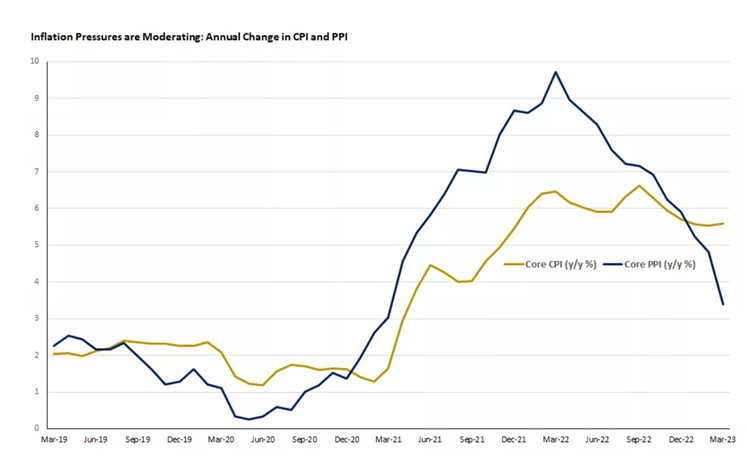
The most anticipated number of the week was Wednesday's release of the U.S. inflation report (CPI) for March. Headline CPI rose only 0.1% on a sequential basis, slightly less than expected. On a rolling year basis, the rate is now 5.0%, the slowest pace of price increases since May 2021. 

On Thursday, another encouraging U.S. inflation statistic delighted investors. It was the rate of price increases on the producer side. The core PPI index fell 0.1% in March, marking the first decline since the height of the confines in April 2020.

Core CPI over a sliding year (in yellow) and Core PPI over a sliding year (in blue).

Picture2 - Copy

Source: Edward Jones, Factset


Chart #3 — 

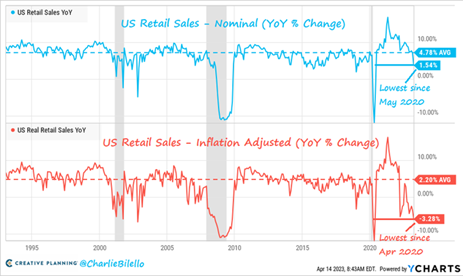
US retail sales in March declined by 1% MoM

Retail sales in the United States were disappointing. In March, retail sales rose by only 1.5% year-on-year, the weakest growth rate since May 2020 and well below the historical average of 4.8%. After adjusting for inflation, the picture is much worse. Real retail sales have fallen 3.3% over the past year, the seventh consecutive year-over-year decline. The U.S. consumer, which accounts for about 80% of the economy, continues to suffer from rising prices.

U.S. retail sales on a nominal year-over-year basis (blue) and on an actual year-over-year basis (red)

Picture3 - Copy

Source: Charlie Bilello 


Chart #4 — 

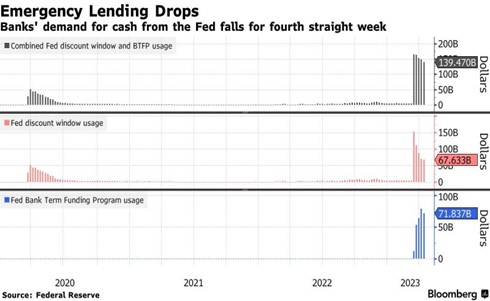
Some signs of easing on the US banking crisis side


US banks' requests for liquidity from the US Federal Reserve are down for the 4th week in a row. Let's see if the first quarter results of US banks confirm that the bulk of the banking crisis is indeed behind us.

Picture4 - Copy

Source: Bloomberg, Federal Reserve 


Chart #5 — 

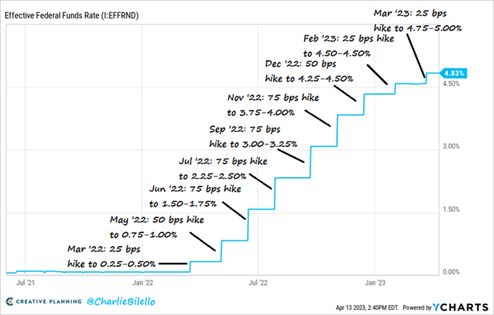
The probability of a 25 basis point rate hike by the Fed in May is now 85%


The Fed meets again on May 3 and the market is currently pricing in an 85% chance of a 10th rate hike (25 basis point increase to 5.00-5.25%). When was the last time we saw U.S. interest rates above 5%? It was September 2007…


Picture5-Apr-18-2023-08-14-28-8762-AM

Source: Charlie Bilello 


Chart #6 — 

Ferrari and LVMH shares reach all-time highs


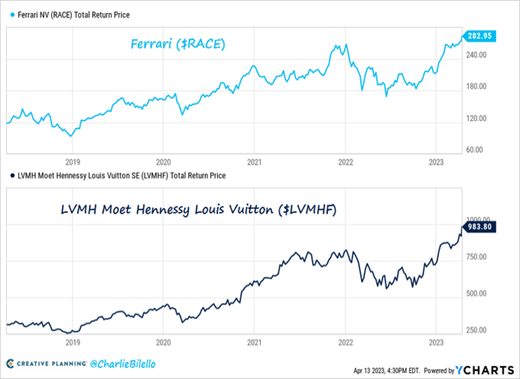
Following the release of record quarterly figures (sales up +17% year-on-year), LVMH shares reached a new all-time high on the Paris stock exchange, positioning the company among the top 10 global companies in terms of market capitalization (444 billion euros). In addition, Bloomberg notes that LVMH's strong numbers were boosted by Chinese shoppers rushing to buy luxury goods after the Covid pandemic-related lockdown. Bernard Arnault remains the richest man in the world with a fortune that now stands at$210 billion. The luxury sector is doing well as the Ferrari stock has also reached a new historical high. Ferrari stock is now trading at a higher Price to Sales and Price to Earnings multiples than Tesla (9.7x vs. 7.9x and 52.7x vs. 51.3x respectively).


Picture6-Apr-18-2023-08-15-42-0168-AM

Source: Charlie Bilello


Chart #7 — 

Ether breaks $2,000 and outperforms bitcoin on the week


Crypto-currencies had a good week, surpassing a market capitalization of $1.3 trillion. Bitcoin (BTC) held above 
$30,000, reaching $31,000 on Thursday night. But it was ether (ETH) that was the big winner of the week, surpassing $2100, up more than 12% over the past 7 days. 
As a reminder, an important update on the Ethereum blockchain took place on Wednesday. This is the "Shanghai" update.  Since December 2020, validators can deposit 
("staker") 32 ethers on the Ethereum blockchain to secure it. Today, Ethereum has more than 562,000 validators, who have "staked" more than 18 million ethers. 
Thanks to Shanghai, these 18 million ethers (equivalent to 33 billion dollars at the current price) can be recovered by their owners (the validators). Before this update, the market feared that some validators could take advantage of this update to sell their ethers, acquired cheaper than the current price. 


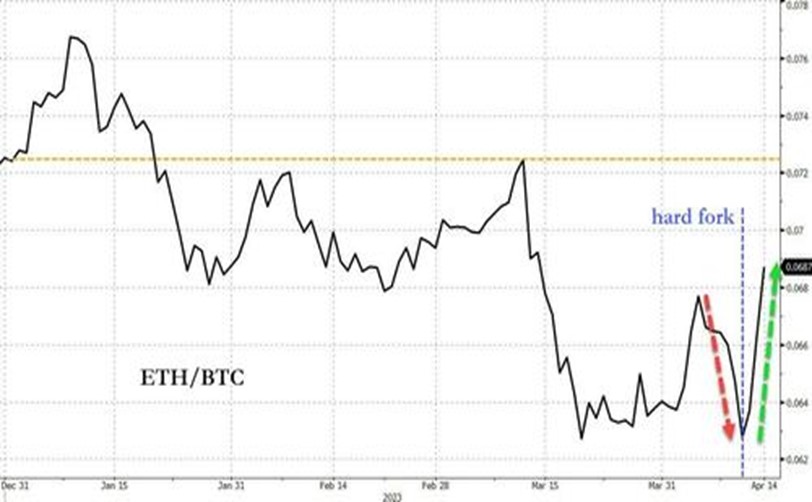
But the massive sale of ether did not happen, which caused a significant rebound in ether. As the chart below shows, the ether underperformed bitcoin before the update but has outperformed bitcoin since Wednesday.

Picture7-Apr-18-2023-08-17-01-3618-AM


Source: Bloomberg, www.zerohedge.com 

Disclaimer

This marketing document has been issued by Bank Syz Ltd. It is not intended for distribution to, publication, provision or use by individuals or legal entities that are citizens of or reside in a state, country or jurisdiction in which applicable laws and regulations prohibit its distribution, publication, provision or use. It is not directed to any person or entity to whom it would be illegal to send such marketing material. This document is intended for informational purposes only and should not be construed as an offer, solicitation or recommendation for the subscription, purchase, sale or safekeeping of any security or financial instrument or for the engagement in any other transaction, as the provision of any investment advice or service, or as a contractual document. Nothing in this document constitutes an investment, legal, tax or accounting advice or a representation that any investment or strategy is suitable or appropriate for an investor's particular and individual circumstances, nor does it constitute a personalized investment advice for any investor. This document reflects the information, opinions and comments of Bank Syz Ltd. as of the date of its publication, which are subject to change without notice. The opinions and comments of the authors in this document reflect their current views and may not coincide with those of other Syz Group entities or third parties, which may have reached different conclusions. The market valuations, terms and calculations contained herein are estimates only. The information provided comes from sources deemed reliable, but Bank Syz Ltd. does not guarantee its completeness, accuracy, reliability and actuality. Past performance gives no indication of nor guarantees current or future results. Bank Syz Ltd. accepts no liability for any loss arising from the use of this document.
Read More

Straight from the Desk

Syz the moment

Live feeds, charts, breaking stories, all day long.

Thinking out loud

Sign up for our weekly email highlighting the most popular posts.

Follow us

Thinking out loud

Investing with intelligence

Our latest research, commentary and market outlooks