Charles-Henry Monchau

Chief Investment Officer

Chart #1 — 

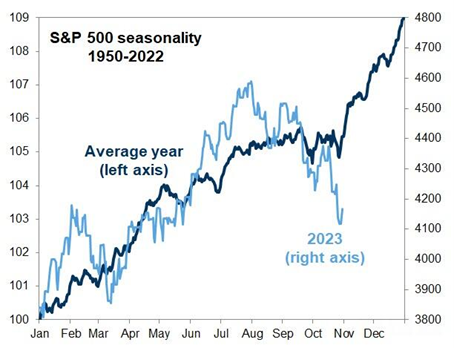
A year-end rally in the making for equity markets?

The dark blue curve below represents the evolution of the S&P 500 index over a calendar year, based on average performance over the period 1950 to 2022. As can be seen, there is a very favourable seasonal pattern in the final months of the year, with the index rising sharply in November and December. This year, the S&P 500 has strayed somewhat from this trend since early summer. Will the index get back on track in the coming weeks?

W7C_231106_i01

Source: FT


Chart #2 — 

Japan equity markets are full of opportunities

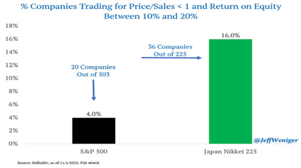
For investors who favour fundamental analysis, a company that generates a return on equity of between 10% and 20% and "pays" for itself less than one-time sales is often seen as a real bargain. This type of opportunity is very rare in the USA, where only 20 stocks in the S&P 500 index meet these criteria. This percentage is four times higher in the Japanese Nikkei 225 index, where 36 companies have these characteristics, i.e., 16% of the index. Warren Buffet called it; he now sees the Japanese equity market as a new source of investment opportunities.

W7C_231106_i02

Source: Jeff Weniger


Chart #3 — 

US equities ultra-dominancy

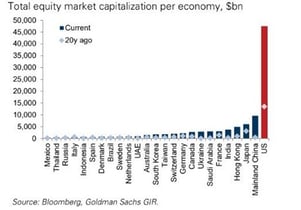
The red bar below represents the market capitalisation of the US equity market. China, Japan, Hong Kong and the various countries that make up the European Union lag far behind. We can also see that this dominance has grown considerably over the past 20 years, the market capitalisation of the various economies in 2003 is represented by a diamond.

W7C_231106_i03


Chart #4 — 

WeWork files for bankrupcty protection

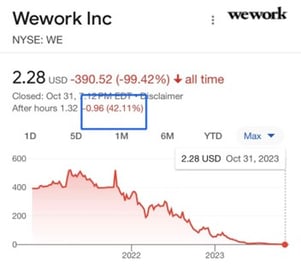
Co-working company WeWork is now in bankruptcy proceedings. Valued at its peak at $47 billion when the company was still unlisted, WeWork was already worth just $9 billion when it went public via a  special purpose acquisition company (SPAC) in 2021. Following the announcement of Chapter 11, the share price plummeted 42% to $1.32. WeWork shares are now down 99% since their Wall Street debut... WeWork was one of the "unicorns" welcomed by investors. The collapse of the share price highlights the dangers of investing in new business models, even when they seem very promising.

W7C_231106_i04

Source: Michael Burry Stock Tracker


Chart #5 — 

The Fed might pause for the long-haul 

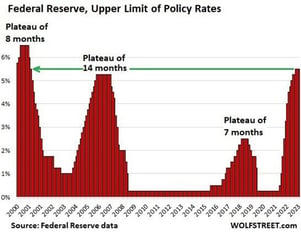
The much-anticipated November meeting of the US Federal Reserve took place last week. For the second month running, the Fed Committee decided to leave key interest rates unchanged. While the Fed revised economic growth projections upwards and acknowledged that wage growth is proving to be more resilient than expected, the committee emphasized that rising bond yields should ultimately slow inflation. This message has been heard by Wall Street, which is now counting on a lasting pause in the rate hike cycle. Indeed, the market is giving a very low probability (less than 20%) to a rate hike at the last meeting of the year in December. This is not the first time that the Federal Reserve has kept interest rates unchanged before deciding to lower them. In the early 2000s, the "plateau" lasted 8 months. Before the great financial crisis of 2008, the pause had lasted 14 months, compared with just 7 months in 2018-2019. How long will the plateau last in the current cycle?

W7C_231106_i05


Chart #6 — 

The McDonald’s price index

This Mcdonald's ad dates back to 1961. It promises to feed a family of 5 with a hamburger / fries / milk shake for a bill of 2 dollars and 25 cents. Today, the same meal costs 23 dollars and 25 cents, an increase of 933%.

W7C_231106_i06

Source: Rudy Havenstein


Chart #7 — 

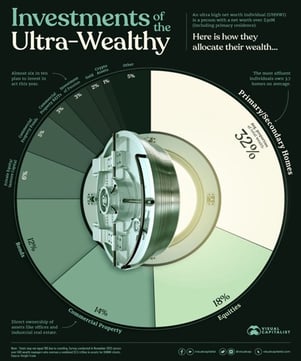
How are the ultra-wealthy investing their assets?

According to a Knight Frank survey of 500 wealth management companies with some $2.5 trillion in assets under management, here's what the aggregate asset allocation of the world's wealthiest individuals looks like. Primary and secondary residences make up around 32% of wealth. Next come equities (18%), then direct commercial real estate (14%), bonds (12%) and venture capital (6%). Gold accounts for just 2% and digital assets for less than 1%. Art and collectibles (3%) appear to be among the future priorities of the ultra-rich, since 60% of them intend to increase their exposure to this asset class.

W7C_231106_i07

Source: Visual Capitalist


Disclaimer

This marketing document has been issued by Bank Syz Ltd. It is not intended for distribution to, publication, provision or use by individuals or legal entities that are citizens of or reside in a state, country or jurisdiction in which applicable laws and regulations prohibit its distribution, publication, provision or use. It is not directed to any person or entity to whom it would be illegal to send such marketing material. This document is intended for informational purposes only and should not be construed as an offer, solicitation or recommendation for the subscription, purchase, sale or safekeeping of any security or financial instrument or for the engagement in any other transaction, as the provision of any investment advice or service, or as a contractual document. Nothing in this document constitutes an investment, legal, tax or accounting advice or a representation that any investment or strategy is suitable or appropriate for an investor's particular and individual circumstances, nor does it constitute a personalized investment advice for any investor. This document reflects the information, opinions and comments of Bank Syz Ltd. as of the date of its publication, which are subject to change without notice. The opinions and comments of the authors in this document reflect their current views and may not coincide with those of other Syz Group entities or third parties, which may have reached different conclusions. The market valuations, terms and calculations contained herein are estimates only. The information provided comes from sources deemed reliable, but Bank Syz Ltd. does not guarantee its completeness, accuracy, reliability and actuality. Past performance gives no indication of nor guarantees current or future results. Bank Syz Ltd. accepts no liability for any loss arising from the use of this document.
Read More

Straight from the Desk

Syz the moment

Live feeds, charts, breaking stories, all day long.

Thinking out loud

Sign up for our weekly email highlighting the most popular posts.

Follow us

Thinking out loud

Investing with intelligence

Our latest research, commentary and market outlooks