
.png)
Source: Bank of America
We are sorry that for legal reasons we are not able to help US citizens or Canadian residents other than in Ontario, Quebec, or Alberta. Best wishes for the future…
We are sorry that for legal reasons we are not able to help US citizens or Canadian residents other than in Ontario, Quebec, or Alberta. Best wishes for the future…
You chose the following profile. If you made a mistake, please change here USA
This marketing document has been issued by Bank Syz Ltd. It is not intended for distribution to, publication, provision or use by individuals or legal entities that are citizens of or reside in a state, country or jurisdiction in which applicable laws and regulations prohibit its distribution, publication, provision or use. It is not directed to any person or entity to whom it would be illegal to send such marketing material.
This document is intended for informational purposes only and should not be construed as an offer, solicitation or recommendation for the subscription, purchase, sale or safekeeping of any security or financial instrument or for the engagement in any other transaction, as the provision of any investment advice or service, or as a contractual document. Nothing in this document constitutes an investment, legal, tax or accounting advice or a representation that any investment or strategy is suitable or appropriate for an investor's particular and individual circumstances, nor does it constitute a personalized investment advice for any investor.
This document reflects the information, opinions and comments of Bank Syz Ltd. as of the date of its publication, which are subject to change without notice. The opinions and comments of the authors in this document reflect their current views and may not coincide with those of other
Syz Group entities or third parties, which may have reached different conclusions. The market valuations, terms and calculations contained herein are estimates only. The information provided comes from sources deemed reliable, but Bank Syz Ltd. does not guarantee its completeness, accuracy, reliability and actuality. Past performance gives no indication of nor guarantees current or future results. Bank Syz Ltd. accepts no liability for any loss arising from the use of this document.

Charles-Henry Monchau
Chief Investment Officer
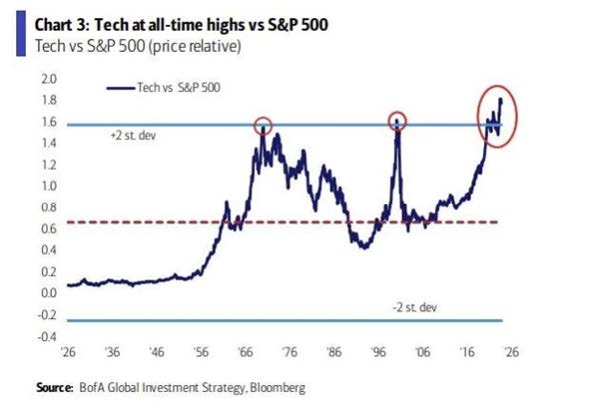
According to the Bank of America chart below, the Nasdaq has reached an all-time high relative to the S&P 500. The current surge has eclipsed the highs of the Internet bubble of 2000 and the peak reached during the bull market of the 1960s.
The current boom in the technology sector is fuelled by the very optimistic outlook for artificial intelligence. Will AI deliver on all its promises, or will we soon see a 2001-2002-style backlash?
Source: Bank of America
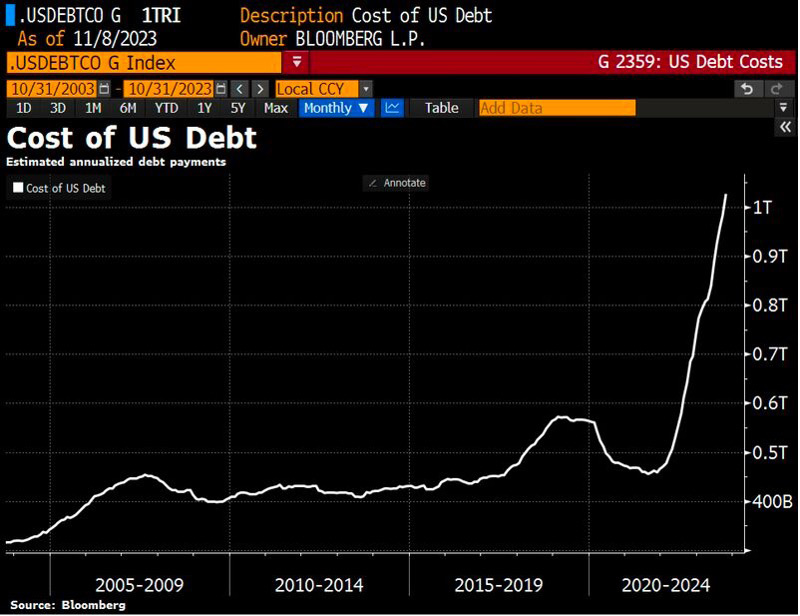
For the first time in history, the cost of US debt exceeds $1 TRILLION per year. It now represents 4% of annual US GDP.
Annualized interest costs have doubled in 19 months, and are now equivalent to 16.3% of the entire federal budget for fiscal year 2022.
Source: Bloomberg
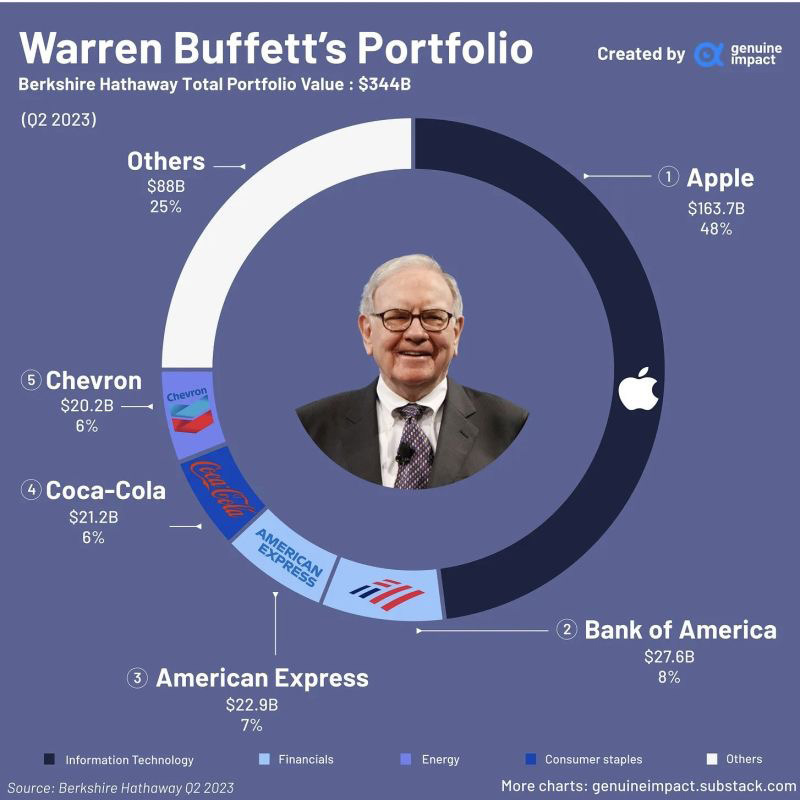
This is how the Oracle of Omaha manages risk. Instead of diversifying portfolios excessively, he takes highly concentrated bets on companies for which his level of conviction and knowledge is very high.
Almost half of Warren Buffett's portfolio consists of Apple (48%), worth $163 billion. The top 5 stocks account for over 75% of the total portfolio.
Source: Genuine Impact
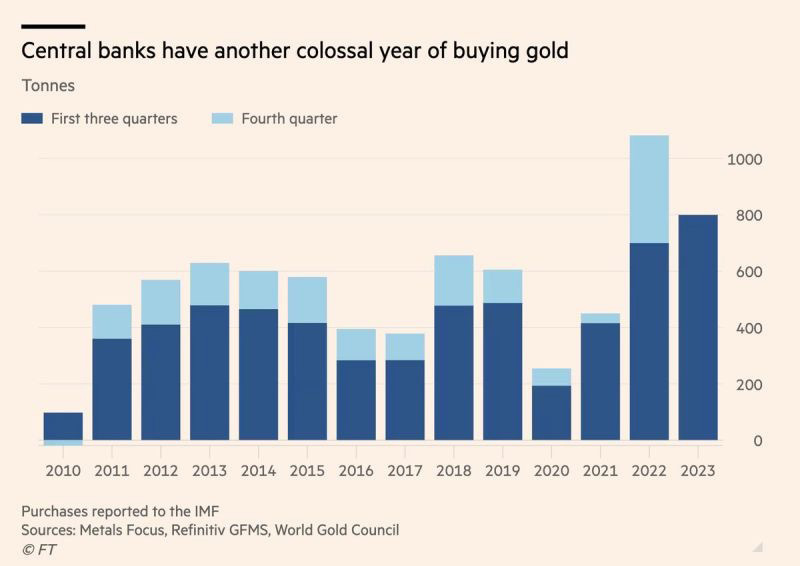
Gold is close to its all-time high, but there seems to be no stopping the accumulation of the precious metal by central banks. After record purchases in 2022 (almost 1,100 tonnes of gold), figures for the first 3 quarters of this year show that central banks' appetite for the yellow metal is not waning, with already 800 tonnes of gold accumulated in 2023. The 2022 record could well be broken. At whose expense are these purchases being made? Probably US Treasuries...
Source: FT
The aggregate hedge fund index recorded a very slight decline in October (-0.2%), and thus held up better than US equities (-2.2%) over the month. However, over 2023, hedge funds are underperforming US large caps by around 5.0% (+4% versus +9.2%). Nevertheless, it's worth noting, that some hedge fund giants are doing very well this year. Citadel is up +13.7%, DE Shaw +9.4% and Millennium +8.3%.
With these exceptions, most major hedge funds continued to underperform equity markets.
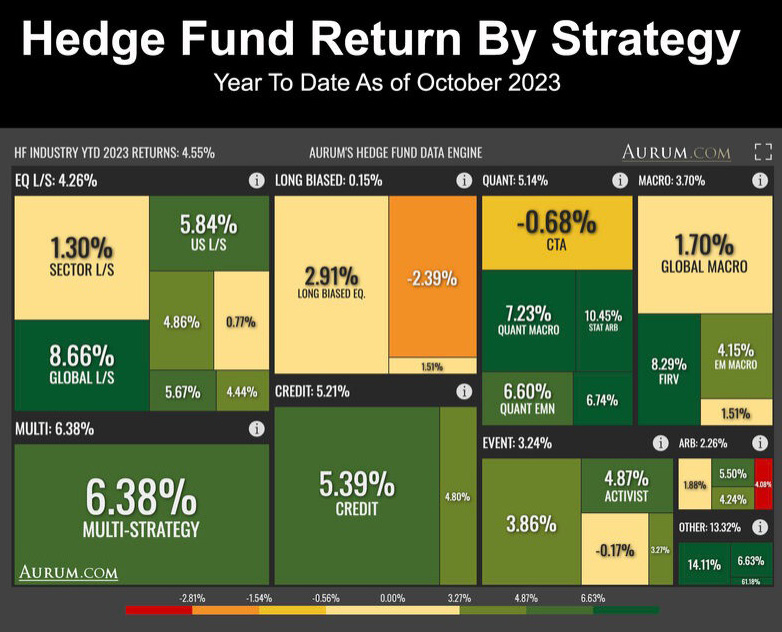
Source: Aurum
So-called "illiquid" assets (venture capital, real estate, infrastructure, private debt) have until now been the preserve of institutional investors. According to a study
by Bain and Prequin, the share of alternative assets in endowments (e.g. university endowments) and foundations is 54%. Pension funds and sovereign wealth funds invest around a quarter of their assets in this type of strategy.
Interestingly, the proportion of alternative assets held by private investors remains relatively low. However, it stands at 19% for the ultra-wealthy, the $30 billion-plus category, which also includes family offices. But for individuals with financial assets of between $5 and $30 million, the allocation is just 3%. And this share is close to 0% for individuals with assets of less than $5 million. The big names in alternative investment are betting that private client allocations to alternative investments could rise sharply over the next few years.
For Apollo Global Management, Inc, Ares Management Corporation, Blackstone and KKR, the segment with the greatest growth potential is the $1-5 million segment. Indeed, the sharp rise in correlation between equities and bonds could prompt private clients to favour new investment opportunities - including alternative assets.
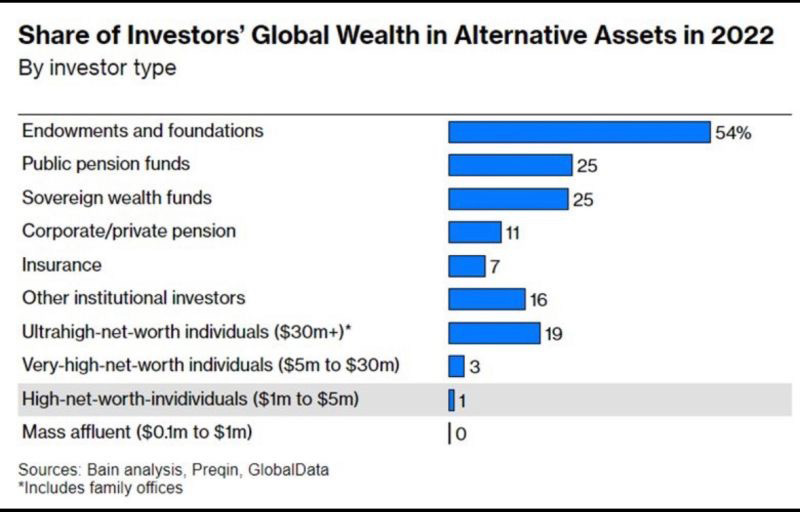
Source: : Bain analysis, Prequin
By the end of 2022, coal will still lead the world in electricity generation, with a 35% share. It is followed by natural gas (23%) and hydropower (15%). Excluding the latter, so-called renewable energy sources account for less than 15% of electricity generation.
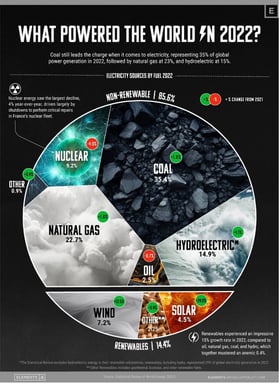
Source: Elements, Visual Capitalist
This marketing document has been issued by Bank Syz Ltd. It is not intended for distribution to, publication, provision or use by individuals or legal entities that are citizens of or reside in a state, country or jurisdiction in which applicable laws and regulations prohibit its distribution, publication, provision or use. It is not directed to any person or entity to whom it would be illegal to send such marketing material. This document is intended for informational purposes only and should not be construed as an offer, solicitation or recommendation for the subscription, purchase, sale or safekeeping of any security or financial instrument or for the engagement in any other transaction, as the provision of any investment advice or service, or as a contractual document. Nothing in this document constitutes an investment, legal, tax or accounting advice or a representation that any investment or strategy is suitable or appropriate for an investor's particular and individual circumstances, nor does it constitute a personalized investment advice for any investor. This document reflects the information, opinions and comments of Bank Syz Ltd. as of the date of its publication, which are subject to change without notice. The opinions and comments of the authors in this document reflect their current views and may not coincide with those of other Syz Group entities or third parties, which may have reached different conclusions. The market valuations, terms and calculations contained herein are estimates only. The information provided comes from sources deemed reliable, but Bank Syz Ltd. does not guarantee its completeness, accuracy, reliability and actuality. Past performance gives no indication of nor guarantees current or future results. Bank Syz Ltd. accepts no liability for any loss arising from the use of this document.
Meanwhile, Wall Street's long-term earnings expectations for the S&P 500 are now at record levels. Each week, the Syz investment team takes you through the last seven days in seven charts.
Meanwhile, corporate leadership is evolving rapidly: only 135 of the S&P 500 constituents from 1996 are still in the index today, while the EU goods trade deficit with China is close to a record €376bn. Each week, the Syz investment team takes you through the last seven days in seven charts.
Meanwhile, Trump’s personal crypto earnings in 2025 topped the combined profits of every publicly listed US crypto company. Each week, the Syz investment team takes you through the last seven days in seven charts.
Live feeds, charts, breaking stories, all day long.
Our latest research, commentary and market outlooks