Charles-Henry Monchau

Chief Investment Officer

Chart #1 — 

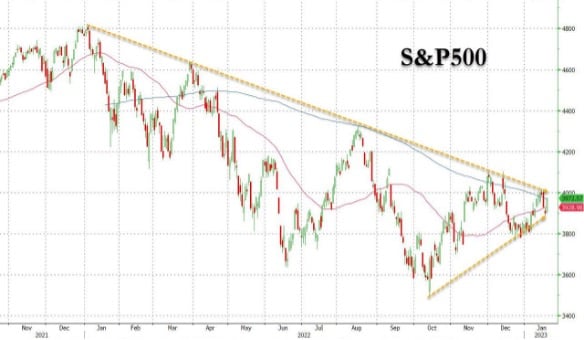
The S&P 500 in consolidation mode 

The major U.S. stock market indices ended the week mixed, with recession fears seemingly weighing on investor sentiment. The Dow Jones underperformed and gave up some of its year-to-date gains, while the Nasdaq posted a modest gain. Indeed, easing inflation fears have allowed growth stocks to outperform as the prospect of lower interest rates supports their valuation multiples. 

The S&P 500 Index remains volatile and continues to oscillate within a long consolidation triangle. The index climbed back above its 200-day moving average on Friday after breaking it to the downside earlier this week.  

S&P 500 index with 50 day and 200 day moving average

Picture1-4Source: Bloomberg, www.zerohedge.com 


Chart #2 — 

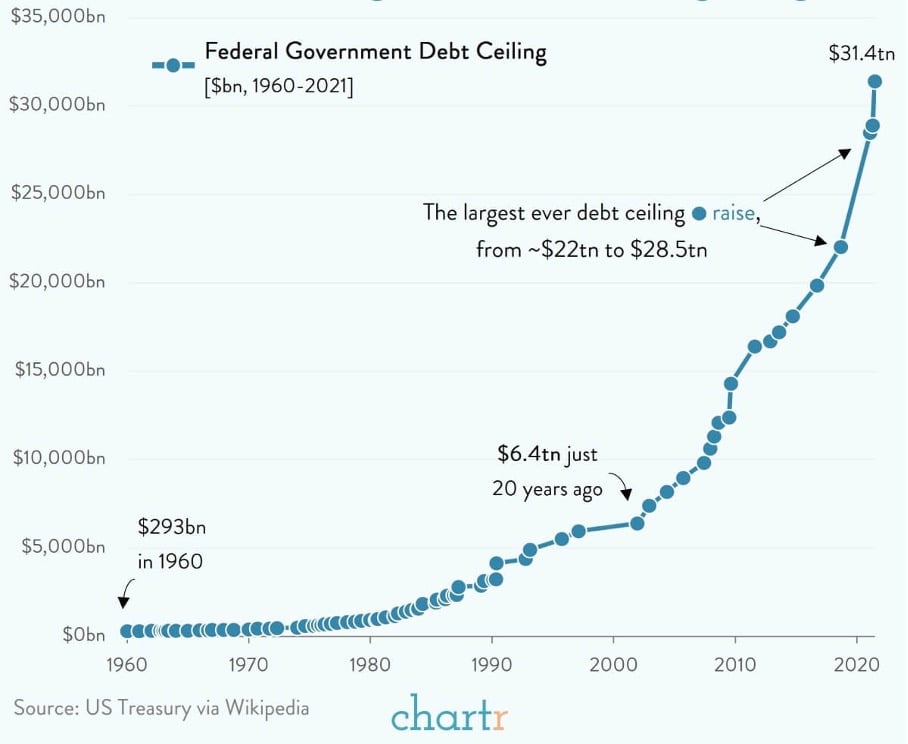
The come-back of the Debt ceiling debate 

On Thursday, the U.S. federal government reached its debt ceiling, the limit on federal budget borrowing, which is currently set at $31.4 trillion. In the wake of this, the cost of insuring against a U.S. default jumped; the price of one-year CDS is now trading at 69 basis points.

U.S. may have to raise its ever-raising debt ceiling again

Picture2-Jan-23-2023-04-44-21-0230-PMSource: chartr


Chart #3 — 

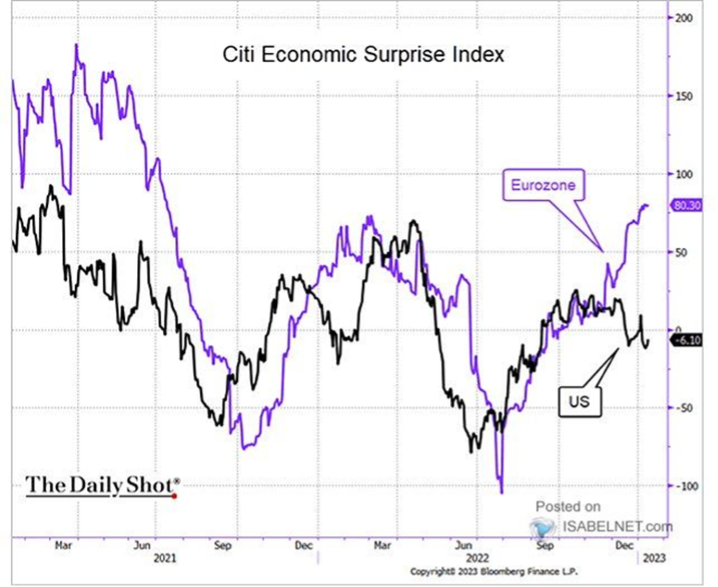
Dichotomy between US and European macroeconomic surprise 

In a sign that the U.S. economy is slowing, retail sales fell 1.1% in December, about three times the consensus estimate. Industrial production fell 0.7% in December, the largest decline since September 2021, led by a 1.3% drop in manufacturing output. 

Meanwhile, inflationary pressures are easing, with producer prices falling 0.5 percent in December, the largest decline since the start of the pandemic. The labor market has remained strong, however, with weekly jobless claims falling to their lowest level since April 2022.

The situation is different in Europe, which is benefiting from fiscal policy measures, while the United States is facing a debt ceiling problem.

Economic surprises index in the US and in Europe 

Picture3-4Source: The Daily Shot 


Chart #4 — 

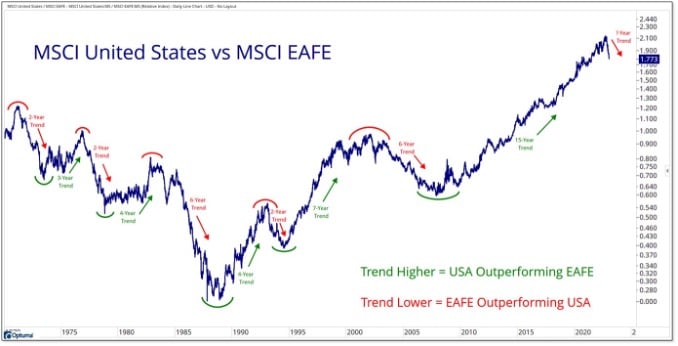
Is the US equities outperformance cycle over? 

The dichotomy in macroeconomic performance between the two economic superpowers is reflected in the performance gap in equity markets. While the S&P 500 is up 3.5% year to date, an index of European and Asian equity performance (MSCI EAFE) is up 7% year to date. After 15 years of U.S. dominance, other developed markets may be making up for some of their lag. 

MSCI USA index vs. MSCI EAFE (Europe and Far East) index 

Picture4-1Source: Willie Delwiche


Chart #5 — 

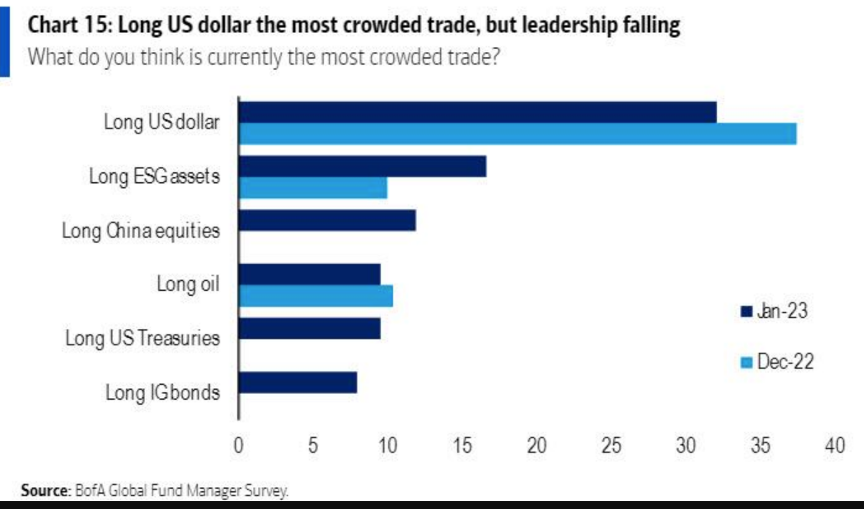
The most “crowded trades”

According to a Bank of America survey, the most common positions among fund managers in January 2023 are:

1) Long the U.S. dollar (32%)

2) Long ESG assets (17%)

3) Long Chinese equities (12%)

4) Long oil (9%)

5) Long US Treasuries (9%)

6) Long corporate bonds with an investment grade rating

Crowded trades in January 2023 according to BofA survey of fund managers

Picture5-2Source: BofA


Chart #6 — 

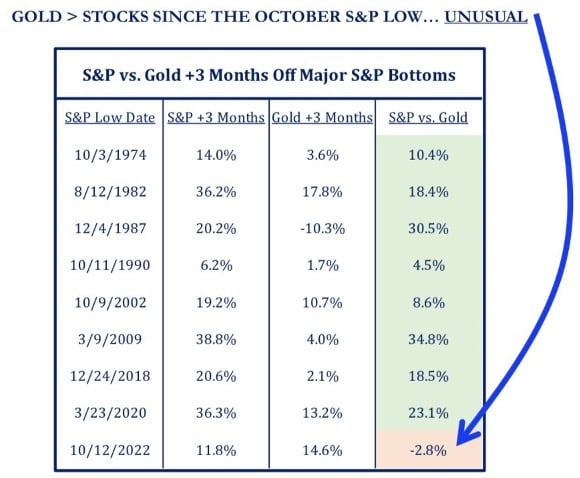
For the first time in 50 years, gold outperforms the S&P 500 in the first three months following an equity market low  

In previous bear markets, the S&P 500 index outperformed gold in the three months following the equity market low. We are currently witnessing the opposite scenario. 

Performance of the S&P 500 and gold in the 3 months following a market low

Picture6-3Source: Strategas, Chris Verrone 


Chart #7 — 

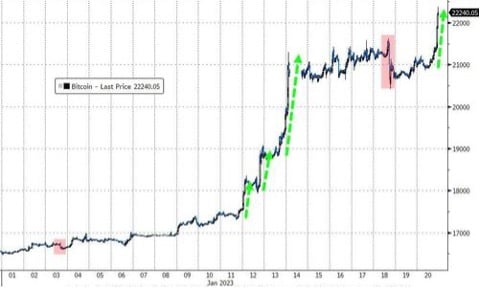
Bitcoin is at its highest level since September 2022 

Bitcoin has risen in 16 of the last 17 days, closing the week above $22,000, its highest level since September 2022. Bitcoin is now trading above the levels of November just before the plunge due to FTX's woes.

Bitcoin (BTC) since the start of the year

Picture7-3Source: Bloomberg, www.zerohedge.com 

Disclaimer

This marketing document has been issued by Bank Syz Ltd. It is not intended for distribution to, publication, provision or use by individuals or legal entities that are citizens of or reside in a state, country or jurisdiction in which applicable laws and regulations prohibit its distribution, publication, provision or use. It is not directed to any person or entity to whom it would be illegal to send such marketing material. This document is intended for informational purposes only and should not be construed as an offer, solicitation or recommendation for the subscription, purchase, sale or safekeeping of any security or financial instrument or for the engagement in any other transaction, as the provision of any investment advice or service, or as a contractual document. Nothing in this document constitutes an investment, legal, tax or accounting advice or a representation that any investment or strategy is suitable or appropriate for an investor's particular and individual circumstances, nor does it constitute a personalized investment advice for any investor. This document reflects the information, opinions and comments of Bank Syz Ltd. as of the date of its publication, which are subject to change without notice. The opinions and comments of the authors in this document reflect their current views and may not coincide with those of other Syz Group entities or third parties, which may have reached different conclusions. The market valuations, terms and calculations contained herein are estimates only. The information provided comes from sources deemed reliable, but Bank Syz Ltd. does not guarantee its completeness, accuracy, reliability and actuality. Past performance gives no indication of nor guarantees current or future results. Bank Syz Ltd. accepts no liability for any loss arising from the use of this document.
Read More

Straight from the Desk

Syz the moment

Live feeds, charts, breaking stories, all day long.

Thinking out loud

Sign up for our weekly email highlighting the most popular posts.

Follow us

Thinking out loud

Investing with intelligence

Our latest research, commentary and market outlooks