Charles-Henry Monchau

Chief Investment Officer

Chart #1 — 

UBS to buy Credit Suisse for 3 billion Swiss francs 

Earlier this weekend, the Swiss National Bank and regulator Finma told their international counterparts that they considered a deal with UBS to be the only option to stem the collapse of confidence in Credit Suisse. According to the Financial Times, the bank's deposit outflows exceeded 10 billion Swiss francs a day last week, as fears for its future intensified.

The boards of both banks met this weekend. Credit Suisse's top regulators in the U.S., U.K. and Switzerland reviewed the legal structure of a deal and the concessions UBS was seeking.

UBS wants to be allowed to phase in any capital requirements it would face. In addition, UBS has requested some form of indemnification or government agreement to cover future legal costs.

UBS had a market value of $65 billion, while Credit Suisse was worth $8 billion on Friday. The buyout offer is 59% below Friday's stock price. 
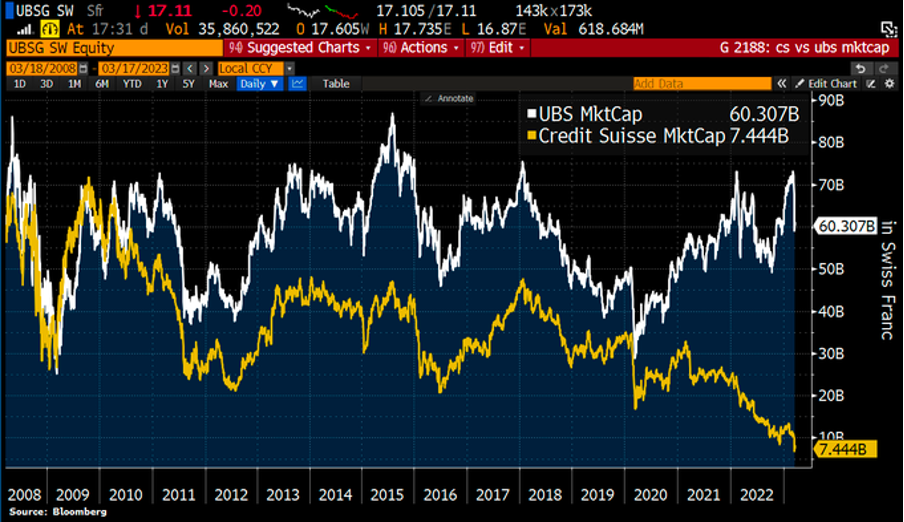
Picture1-Mar-20-2023-05-08-53-8174-PM

Source: Bloomberg


Chart #2 — 

Two bank failures in the United States in one week


2023 is already the worst year in U.S. history for bank failures, if you look at the deposits held by failed banks. The second and third largest bank failures in U.S. history have occurred in recent days. In aggregate, Silicon Valley Bank and Signature held $263 billion in deposits. That's more than the deposit exposure of the failed banks in 2008. According to a study by economists shared by the Wall Street Journal, as many as 186 banks currently face the same risks as Silicon Valley Bank.

Banks were caught off guard by the Fed's rapid rise in interest rates and the withdrawal of liquidity from the financial system via quantitative tightening. This has led simultaneously to a decline in deposits and an accumulation of unrealized losses on banks' balance sheets. This double shock creates a risk for many US banks, especially for small regional banks, which are even more exposed to this dynamic in terms of liquidity and funding. Indeed, the inversion of the yield curve is more detrimental to the business model of regional banks than to that of large universal banks. Unlike the large banks, they have done little to hedge the risk of rising interest rates.

Picture2-Mar-20-2023-05-10-10-2022-PM

Source: Charlie Bilello


Chart #3 — 

U.S. stocks are holding up. Thanks to a new form of QE? 


Despite the tensions in the banking sector and fears of a further slowdown in the economy, the S&P 500 closed up +1.5% and the Nasdaq 100 up +5.8%. How can we explain this market complacency? Traders are banking on the fact that the US Federal Reserve will be forced to suspend its interest rate hike cycle. The "Fed Put" could also be back. Indeed, the Federal Reserve's balance sheet increased by $297 billion last week, the largest increase since March 2020. Thus, nearly half of the quantitative tightening (QT) done since last April was made up in a single week. Financial institutions have borrowed billions of dollars in short term from the Fed, as the sector faces a severe crisis of confidence and liquidity. 

Picture3-Mar-20-2023-05-11-09-7156-PM

Source: Charlie Bilello


Chart #4 — 

The come back of mega-cap tech stocks


A ratio of large cap growth stocks to the S&P 500 is at its highest level since April 2022. Over the last 10 trading sessions, this basket, which is compiled by the investment bank Goldman Sachs, is up 6.2%. Over the same period, the Russell 2000 index of U.S. small and mid-caps is down 9.8%. This 16% difference is the second largest of all time. 

Picture4-Mar-20-2023-05-12-11-7639-PM

Source: Bloomberg 


Chart #5 — 

Volatility is more visible in the bond markets than in the equity markets 


It is very rare to see such volatility in the bond markets. U.S. 2-year Treasuries moved up and down by more than 25 basis points in several consecutive sessions last week.  

On Friday, futures markets were giving no probability of a 50-basis point Fed hike in March, up from 40% the week before. The entire U.S. Treasury yield curve fell over the week, with short-term yields experiencing the largest decline. The U.S. 10-year yield hit an intraday low of 3.37% on Thursday.

Picture5-Mar-20-2023-05-13-05-8421-PM

Source: Bloomberg


Chart #6 — 

Commodities are down 37% from their March 2022 high


The S&P GSCI Commodity Index reached its lowest level since December 2021. The 25% year-over-year decline in this index is the largest since May 2020. The energy sector is the most negative contributor to performance. Crude oil futures fell below $70 per barrel, down 47% from last year's peak of $130. It would seem that this asset class is the most affected by fears of a global recession. On the other hand, gold continues to appreciate and rose nearly 6% last week, approaching the psychological threshold of $2,000 per ounce. 

Picture6-4

Source: Charlie Bilello


Chart #7 — 

Bitcoin takes advantage of the banking crisis  


Crypto-currencies appreciated sharply during the week. For the first time since June 2022, bitcoin is trading at the $27,000 level. Its performance since the beginning of the year is about +50%. A trajectory that deviates significantly from that of the regional banks. 

Picture7-Mar-20-2023-05-15-01-1955-PM

Source: Tradingview, Hive 


Image source: infomagazine.ma

Disclaimer

This marketing document has been issued by Bank Syz Ltd. It is not intended for distribution to, publication, provision or use by individuals or legal entities that are citizens of or reside in a state, country or jurisdiction in which applicable laws and regulations prohibit its distribution, publication, provision or use. It is not directed to any person or entity to whom it would be illegal to send such marketing material. This document is intended for informational purposes only and should not be construed as an offer, solicitation or recommendation for the subscription, purchase, sale or safekeeping of any security or financial instrument or for the engagement in any other transaction, as the provision of any investment advice or service, or as a contractual document. Nothing in this document constitutes an investment, legal, tax or accounting advice or a representation that any investment or strategy is suitable or appropriate for an investor's particular and individual circumstances, nor does it constitute a personalized investment advice for any investor. This document reflects the information, opinions and comments of Bank Syz Ltd. as of the date of its publication, which are subject to change without notice. The opinions and comments of the authors in this document reflect their current views and may not coincide with those of other Syz Group entities or third parties, which may have reached different conclusions. The market valuations, terms and calculations contained herein are estimates only. The information provided comes from sources deemed reliable, but Bank Syz Ltd. does not guarantee its completeness, accuracy, reliability and actuality. Past performance gives no indication of nor guarantees current or future results. Bank Syz Ltd. accepts no liability for any loss arising from the use of this document.

Read More

Straight from the Desk

Syz the moment

Live feeds, charts, breaking stories, all day long.

Thinking out loud

Sign up for our weekly email highlighting the most popular posts.

Follow us

Thinking out loud

Investing with intelligence

Our latest research, commentary and market outlooks