Charles-Henry Monchau

Chief Investment Officer

S&P 500 performance is driven by only a few stocks 

As we all know, the sunken part of an iceberg can be very different from what is visible on the surface. This allegory seems particularly apt for what we have seen in the U.S. equity markets since the beginning of 2023.
While the S&P 500 and Nasdaq indices have performed remarkably well since the beginning of the year (8% and 17% respectively), only a very limited number of stocks have contributed to the indices' advance.
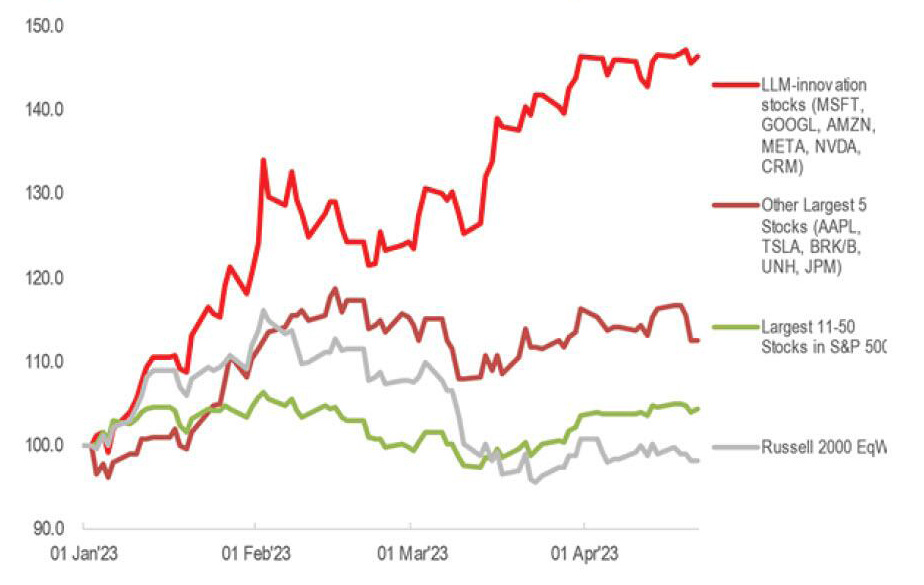
Indeed, the 10 largest market capitalizations are responsible for 86% of the overall performance of the S&P 500 Index since the beginning of the year. As shown in the chart below, an index made up of the 5 largest market capitalizations (Apple, Microsoft, Amazon, Nvidia and Google/Alphabet) is up +29.8% since the beginning of the year. The index made up of the other 495 stocks in the S&P 500 is up "only" 3.7% over the same period.

Performance of the 5 largest contributors to the S&P 500, the S&P 500 Index and the index that represents the remaining 495 stocks

pic 1-May-02-2023-03-25-39-6200-PM

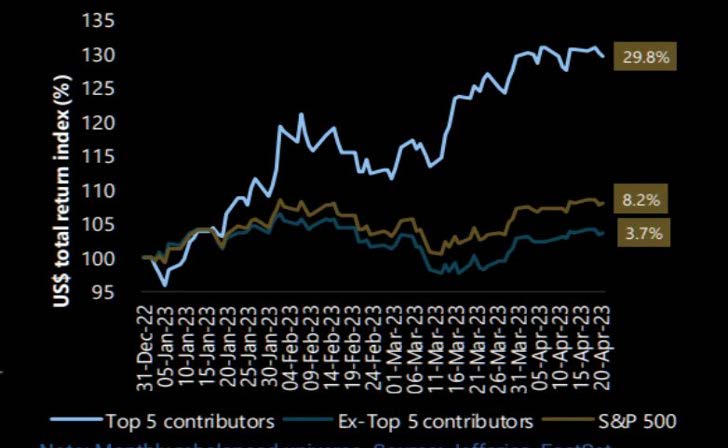
Source: TME, Jefferies, Factset


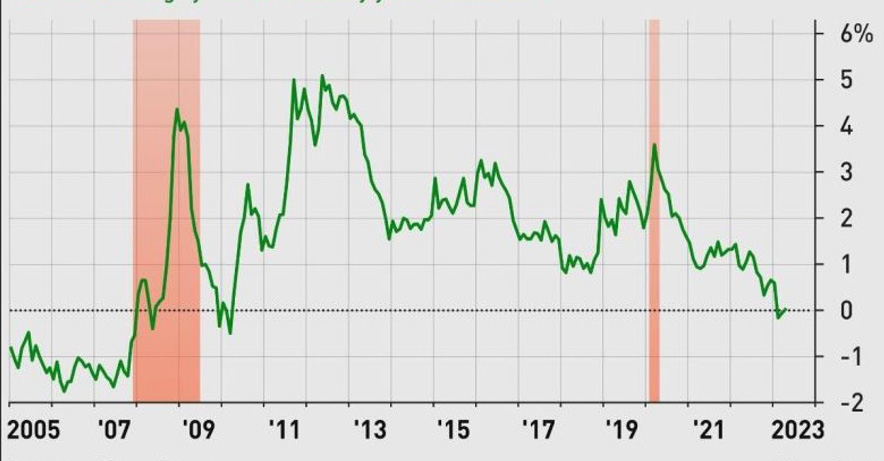
 The performance gap between the S&P 500 and the S&P 500 Equal Weight - i.e. an index where each component has the same weight - has been relatively large since the beginning of the year (over 600 basis points difference).

Performance of the S&P 500 Index vs. the S&P 500 Equal Weight Index 

pic 2-May-02-2023-03-27-45-5567-PM

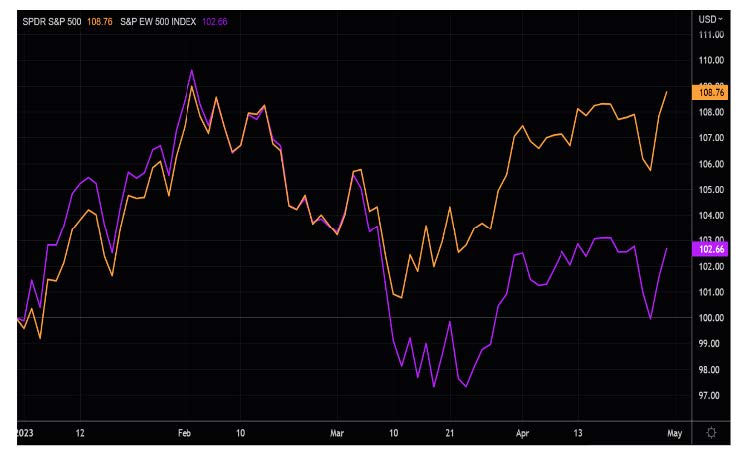
Source: TME, Refinitiv

A more precise calculation shows that two stocks alone - Apple and Microsoft - are responsible for half of the index's increase. It should also be noted that the major U.S. indices have rarely been so concentrated on a few stocks. Indeed, the two stocks mentioned above represent 13.4% of the S&P 500 index. The ten largest capitalizations represent 

28.7% of the S&P 500, a percentage slightly below the highs observed during the GAFAs bubble in 2020-2021, but well above the dot-coms bubble in 2000-2001.  


Artificial intelligence and LLM, the new 
bubble? 

For JP Morgan strategists, a new thematic bubble may be forming, of companies exposed to artificial intelligence and Large Language Model (LLM). As shown in the chart below, the 6 large caps related to this theme (Microsoft, Alphabet/Google, Amazon, Meta/Facebook, Nvidia and Salesforce. com) have recorded a cumulative market capitalization increase of $1.4 trillion since the beginning of the year, a weighted performance of +45%. 

A breakdown of the S&P 500 Index performance in 2023

pic 3-May-02-2023-03-33-48-3066-PM

Source: JPM

The current corporate earnings season reveals the importance given to this theme by companies and investors. It is no coincidence that Alphabet/Google executives mentioned the term artificial intelligence no less than 58 times during the press conference following the release of Q1 results.    

Are valuation levels too high?

Investors were relatively reassured following the Q1 earning of the FAANGs that reported last week.Microsoft, Meta/Facebook, Google/Alphabet and Amazon all reported earnings per share and revenue above consensus expectations. The first two rose sharply in the session following the releases (+7.2% for Microsoft and +13.9% for Meta/Facebook) even though their 2023 performance was already spectacular (Meta/Facebook has almost doubled this year...). 

Four FAANGs released their Q1 numbers last week

pic 4-May-02-2023-03-36-06-0751-PM

Source: Saxo Bank

However, Q1 results confirmed an inexorable trend for these tech giants: because of their size, it is increasingly difficult for them to grow their revenues. Based on Q1 results, Alphabet/Google and Meta/Facebook show a 3% year-on-year revenue growth, Microsoft 7% and Amazon 9%. For the latter, an analysis of real revenue growth (which takes inflation into account) shows almost no growth.


Amazon's real revenue growth (%)

pic 5-May-02-2023-03-39-25-9767-PM

Source: Crescat Capital 

Yet, the valuation multiples paid by investors show that GAFAs are still considered growth stocks by the market. Based on the last 12 months' earnings, Alphabet/Google's price per earning (P/E) is 22x, Meta/Facebook's is 24x, Apple 28x, Microsoft 32x, Amazon 115x and Nvidia 156x.. Concerning the latter, which is often perceived as the most emblematic large tech capitalization of the AI bubble, the price/revenue ratio is 24x which also seems very generous (even if the revenue could continue to grow by 15-20% in the coming years).  
If we take into consideration the valuation of the entire Nasdaq 100, we see that the "earnings yield" (i.e. the inverse of the P/E) is equivalent to the 10-year yield on US Treasury bonds. This indicator, which compares the valuation of an equity market to that of bonds, seems to show that the Nasdaq 100 index (heavily weighted in technology stocks) has rarely been so expensive compared to bonds.  

Nasdaq 100 earnings yield (1/PE) - 10-year US Treasury bond yield 

pic 6-May-02-2023-03-51-28-2185-PM

Source: Bloomberg


Conclusion

Too often, investors tend to comment on how the market should behave, rather than trying to decipher the message it is giving. Clearly, the behavior of the S&P 500 index has been ambivalent and difficult to decipher since the start of the year. On the surface, the S&P 500's increase of more than 8% (i.e. an annualized performance of nearly 26%) gives a rather reassuring picture of the US economy and investor sentiment. On the other hand, the strong dichotomy in performance between the 5 or 10 largest capitalizations and the rest of the index gives a completely different picture,  suggesting that the economy is far from being in good shape. In fact, the Russell 2000 index of small and mid-cap stocks - the one that best represents domestic economic activity - is virtually unchanged since the beginning of the year. 

From a technical analysis perspective, we would like to see an improvement in market depth - the propensity of a large portion of stocks to participate in the primary direction (up or down) of the market. This does not seem to be the case in the US where only 50% of stocks are currently trading above their 200-day moving average. Using the same technical indicator, we see better market depth in the UK 
(72%), Switzerland (75%) and Europe (82% in Germany, 77% in France). However, the concentration effect is also present in Europe. Since the start of the year, more than a third of the performance of the Euro Stoxx 50 index (+15%) is due to five names (LVMH, SAP, L'Oréal, ASML, Hermes). In April, this dynamic was even more pronounced: 90% of the EuroStoxx's increase (+0.75%) was explained by two stocks (Total and LVMH).  
From a fundamental point of view, we believe that we are currently in a delicate phase of the economic cycle. After several quarters of rate hikes (the fastest since the 1980s), the G7 economies have entered a delicate phase. S&P 500 earnings growth is negative for the 4th consecutive quarter and valuation levels are far from cheap. The risk premium offered by risky assets seems insufficient given the interest rates offered by cash and yields to maturity on investment grade bonds. 
We continue to favor an "all-weather" approach in our multi-asset portfolios: a very diversified equity portfolio in terms of style and geography (including some large US technology companies but not only), sovereign and investment grade bonds for the yield component and diversifying assets 
(hedge funds, gold, etc.) to offer protection in case of market crash.    

pic 7-May-02-2023-04-21-25-4462-PM


Disclaimer

This marketing document has been issued by Bank Syz Ltd. It is not intended for distribution to, publication, provision or use by individuals or legal entities that are citizens of or reside in a state, country or jurisdiction in which applicable laws and regulations prohibit its distribution, publication, provision or use. It is not directed to any person or entity to whom it would be illegal to send such marketing material. This document is intended for informational purposes only and should not be construed as an offer, solicitation or recommendation for the subscription, purchase, sale or safekeeping of any security or financial instrument or for the engagement in any other transaction, as the provision of any investment advice or service, or as a contractual document. Nothing in this document constitutes an investment, legal, tax or accounting advice or a representation that any investment or strategy is suitable or appropriate for an investor's particular and individual circumstances, nor does it constitute a personalized investment advice for any investor. This document reflects the information, opinions and comments of Bank Syz Ltd. as of the date of its publication, which are subject to change without notice. The opinions and comments of the authors in this document reflect their current views and may not coincide with those of other Syz Group entities or third parties, which may have reached different conclusions. The market valuations, terms and calculations contained herein are estimates only. The information provided comes from sources deemed reliable, but Bank Syz Ltd. does not guarantee its completeness, accuracy, reliability and actuality. Past performance gives no indication of nor guarantees current or future results. Bank Syz Ltd. accepts no liability for any loss arising from the use of this document.

Read More

Straight from the Desk

Syz the moment

Live feeds, charts, breaking stories, all day long.

Thinking out loud

Sign up for our weekly email highlighting the most popular posts.

Follow us

Thinking out loud

Investing with intelligence

Our latest research, commentary and market outlooks