We had almost become accustomed to the fact that the days when US inflation figures are published almost automatically translate into a down session for the US stock market. Since the end of the Covid-19 phase, the figures have continually surprised on the upside, reaching a peak of 9.1% in June.
The mood changed last Wednesday; for the first time in 18 months, the US inflation figures for July surprised (finally) on the downside. On a rolling 12-month basis, the inflation rate was "only" 8.5%. On a sequential basis, inflation is no longer rising. This is a good surprise for the financial markets because a slowdown in price increases could imply that the coming monetary tightening will be less severe than expected.
As a result, the rebound in U.S. equities looks set to continue.
Should we conclude that the lows are behind us and that we are at the beginning of a new bull market?
The market is positioned too defensively
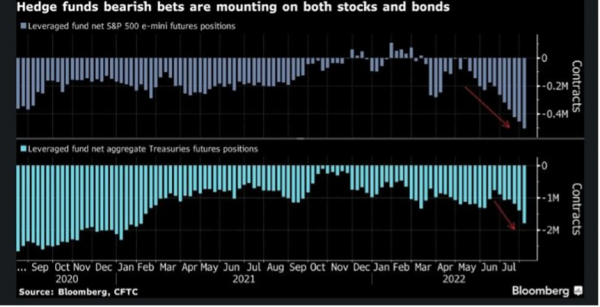
As the saying goes, "the market is always right". The very positive reaction of investors following the publication of an 8.5% inflation figure is a strong message which means first of all that much of the bad news is already in the "price". It is also interesting to analyze the positioning of different categories of investors. While "small" American investors seem to have recently reallocated capital to their favorite Nasdaq stocks, this is not the case for hedge funds. On the contrary: hedge funds are - on an aggregate basis - positioned down on the US market. Therefore, the continuation of the rebound of the US indices could force many hedge funds to hedge their positions, which amounts to buying equities and thus further sustaining the amplitude and duration of the rebound. A virtuous circle - the rise leads to the rise - may be taking place.
Aggregate net exposure of hedge funds to S&P 500 futures (top chart) and U.S. Treasury bill futures
Source: Bloomberg
The US economy and corporate America show resilience
On a fundamental level, it must be noted that Uncle Sam seems - for the time being - to be resisting the various shocks he is facing (rising interest rates, a strengthening dollar, Russia's invasion of Ukraine, etc.).
As evidenced by July's employment figures (unemployment rate at its lowest and job creation twice as high as expected), the risk of a hard landing for the U.S. economy seems to be diminishing.
Admittedly, consumer confidence is at half-mast and business confidence surveys continue to deteriorate. However, consumer spending remains strong and companies are seeing sales growth while their balance sheets and profitability levels are healthy.
With U.S. corporate earnings season nearly over (more than 90% of S&P 500 companies have reported their numbers), 75% of S&P 500 companies reported a positive earnings per share surprise, while 70% reported a positive revenue surprise. For the second quarter of 2022, the aggregate earnings growth rate for the S&P 500 is 6.7%. While this is the lowest aggregate earnings growth rate since Q4 2020, it remains positive even as comparison effects become more challenging.
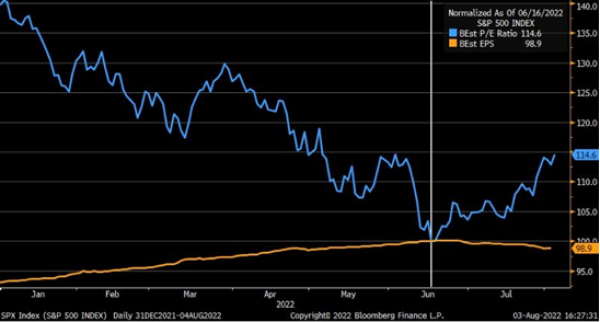
On the downside, however, earnings growth expectations for the next 12 months continue to be revised downward, with the consequence that the rebound in equities since mid-June is entirely explained by an expansion in the P/E multiple. In other words, the market has become more expensive (18x earnings per share for the next 12 months).
S&P 500 P/E (blue line) vs. estimated earnings per share (orange line) since June 16, 2022
Source: Bloomberg
Beware, we remain in a monetary tightening cycle
One of the explanations given for this expansion of the multiple is that the U.S. Federal Reserve may soon change its rhetoric regarding the extent of monetary tightening. We think this optimism is a bit premature. Indeed, despite the relief of seeing the inflation rate curve start to bend, the Fed's mission is far from being accomplished.
First, we need to take a closer look at the inflation numbers released last Wednesday. Three things stand out:
- The drop in the inflation rate is mainly due to the sharp drop in energy prices in July. While the month-on- month inflation rate was 0%, it was up 0.4% excluding energy. It should be noted that there is no guarantee that fuel prices will continue to fall. And that the use of strategic oil reserves to increase supply is likely cease after the mid-term elections in November;
- The median inflation rate (i.e., considering the various elements that make up the consumer price basket) increased by 6.3% year-on-year, i.e., more than in June, indicating that inflationary pressures are becoming more widespread;
- Although the peak of inflation may be behind us, the level of price increases is likely to remain high for many months. We should begin to see significant declines in the rate of inflation when the base effects from the Ukrainian conflict kick in, i.e. after March 2023. We will probably not see a year-on-year rate below 5% until June 2023.
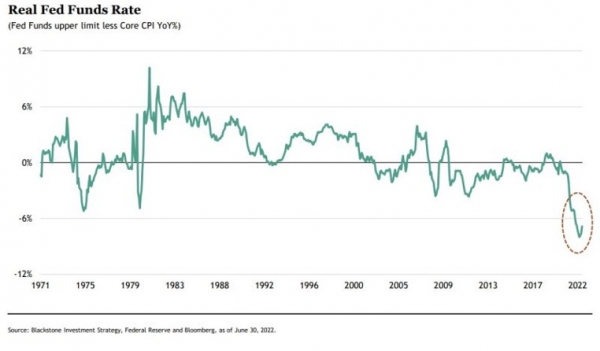
The Fed will therefore have to remain vigilant and continue to give priority to fighting inflation rather than supporting economic growth. Let's not forget that real interest rates remain in very negative territory even though the unemployment rate is at its lowest.
US short-term rates in real terms
Source: Blackstone, Fed, Bloomberg
We therefore remain in a phase of particularly acute monetary tightening, which will take on another dimension as of next month. In September, the Fed will double the effort to reduce the size of its balance sheet. The pace of Quantitative Tightening (QT) will then reach $95 billion per month, at the same time as interest rates are raised. If Quantitative Easing (QE) was good for risky assets, the current monetary policy is still not good for equity markets.
Governments and central banks caught in a trap
Another argument put forward by the most optimistic is the use of fiscal stimulus by the Biden administration. But as in Europe, this type of device risks complicating the Federal Reserve's task. The various measures taken to mitigate the impact of rising prices on household purchasing power are certainly helping to contain the slowdown in economic growth. But these government subsidies also fuel the inflationary dynamic.
In a way, the U.S. government and the Fed are faced with the following dilemma: raising rates without fiscal support would allow inflation to be brought under control, but would then risk plunging the economy into recession. On the other hand, rate hikes that are too timid and accompanied by fiscal support would allow the economy to avoid recession, but inflation would then risk remaining at levels well above the central bank's objective.
This uncomfortable situation could persist and weigh on equity market volatility.
Are investors too complacent?
Regarding volatility, it is worth remembering that the S&P 500 implied volatility index - the VIX or fear index - briefly fell back below 20, a psychological threshold often equated with "complacency".
Given the current environment - U.S.-China tensions over Taiwan, Russia's invasion of Ukraine, rising rates and accelerating QT, lower earnings growth expectations, etc. - is such a level of complacency justified? - Is this level of complacency justified?
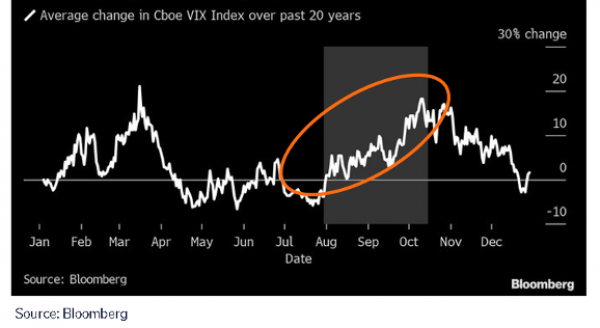
It is worth remembering that volatility historically tends to increase between mid-August and mid-October (see chart below). Here we are...
Seasonality suggests that volatility could increase by the end of the summer
Source: Bloomberg
Conclusions
There are valid reasons for the market rebound: the US economy and companies seem to be absorbing the various shocks they have faced since the beginning of the year, hopes for a sustained slowdown in the inflation rate are boosting investor sentiment, while many professionals are currently positioned too defensively and are likely to further feed the rebound as they hop on the buying bandwagon.
However, as mentioned above, we remain in a phase of monetary tightening with rate hikes and QT. Despite the recent rate hikes, the inflation rate is well above the central bank's target and the real rate remains decidedly negative. While monetary conditions will remain tight, economic activity indicators point to a sharp slowdown ahead.
Earnings expectations are being lowered and the S&P 500 is trading on high multiples. Finally, the market seems to be ignoring some possible "black swans" (Taiwan, energy crisis, etc.).
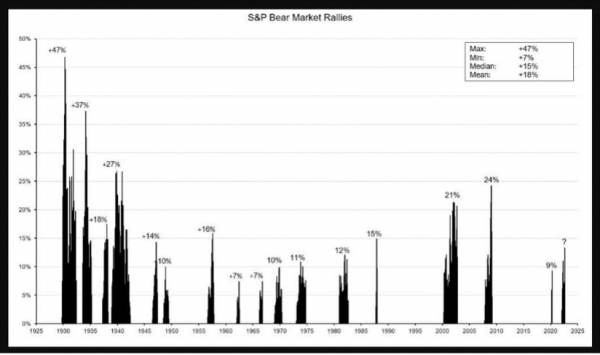
In this context, which investment strategy should we favor? With negative real rates, portfolios must remain invested in order to preserve our clients' purchasing power. But if we have recently increased our equity allocation slightly, our exposure to this asset class remains prudent and well below the percentages allocated during the previous bull market. At this stage, we believe that the current rebound is more akin to a "bear market rally" rather than the beginning of a new bull market. These are perhaps the most complicated market phases to manage because their amplitude and duration are very difficult to estimate. As the chart below shows, this type of rebound can sometimes be very dramatic and take many investors by surprise.
Rising phases of the S&P 500 in what have been defined as a long-term bear market
Source: Bloomberg Markets, Nick Reece
Disclaimer
This marketing document has been issued by Bank Syz Ltd. It is not intended for distribution to, publication, provision or use by individuals or legal entities that are citizens of or reside in a state, country or jurisdiction in which applicable laws and regulations prohibit its distribution, publication, provision or use. It is not directed to any person or entity to whom it would be illegal to send such marketing material. This document is intended for informational purposes only and should not be construed as an offer, solicitation or recommendation for the subscription, purchase, sale or safekeeping of any security or financial instrument or for the engagement in any other transaction, as the provision of any investment advice or service, or as a contractual document. Nothing in this document constitutes an investment, legal, tax or accounting advice or a representation that any investment or strategy is suitable or appropriate for an investor's particular and individual circumstances, nor does it constitute a personalized investment advice for any investor. This document reflects the information, opinions and comments of Bank Syz Ltd. as of the date of its publication, which are subject to change without notice. The opinions and comments of the authors in this document reflect their current views and may not coincide with those of other Syz Group entities or third parties, which may have reached different conclusions. The market valuations, terms and calculations contained herein are estimates only. The information provided comes from sources deemed reliable, but Bank Syz Ltd. does not guarantee its completeness, accuracy, reliability and actuality. Past performance gives no indication of nor guarantees current or future results. Bank Syz Ltd. accepts no liability for any loss arising from the use of this document.
Related Articles
The iShares Expanded Tech-Software ETF (IGV), treated as the benchmark for the sector, has slid almost 30% from its September peak, a sharp reversal for what was considered one of the market’s safest growth franchises. Every technological cycle produces its moment of doubt. For software, that moment may be now.
Nuclear power is getting a second life, but not in the form most people imagine. Instead of massive concrete giants, the future may come from compact reactors built in factories and shipped like industrial equipment. As global energy demand surges and grids strain under new pressures, small modular reactors are suddenly at the centre of the conversation.
Cosmo Pharmaceuticals’ successful Phase III trials in male hair loss has drawn attention to a market long seen as cosmetic. Growing demand for effective treatments has accelerated research and encouraged the rise of biotechnology companies exploring new approaches.


.png)