

.png)
Here we are. Today is November 1st. The time to break out the mackintoshes and scarves. But not only that. In the investment world, it's also the start of the winter market season, historically the most favourable for risky assets. Indeed, stocks have their own seasonality as the year is divided into two periods: winter (from 1 November to 30 April) and summer (from 1 May to 31 October). And these two seasons are characterised by contrasting average and median performances.
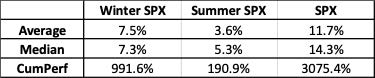
An investment in the S&P 500 Index from November 1 to April 30 of each year between 1988 and 2021 - the "winter season" - generated an average return of 7.5%. An investment in the same index during the "summer season" (May 1 to October 31) resulted in a return of less than half (+3.6%). In cumulative terms, the difference is even more dramatic: 991.6% versus 190.9%.
Average and median performance for the S&P 500 based on seasons (from 1988 to 2021)
Wall Street has long been aware of this seasonal pattern, giving rise to the famous maxim: "sell in May and go away". One might therefore have expected managers to exploit this market curiosity, thereby reducing the seasonality effect. But analysis of the data over the past ten years shows
that the seasonality factor remains strong. Moreover, the researchers found that this seasonal impact is ubiquitous (i.e. observable in many countries), significant and statistically robust over time.
Why such a seasonal bias?
There are several reasons for seasonal patterns. First, money flows and liquidity are more favourable towards the end of the year and the first quarter than during the summer. Indeed, volume tends to dry up during the summer period.
On the other hand, the end and the beginning of a year are rather active months as far as financial flows are concerned: this is the period of corporate dividend distribution, employee bonus payments, 401k contributions, etc. But this seasonal bias is also due to the fact that there is a high level of liquidity at the end of the year.
But this seasonality bias is also due to the fact that investors, governments, business leaders, etc. often have a more optimistic view of the economy and markets in 'winter' than in 'summer'.
For example, governments and economists tend to raise their forecasts for the next year as the end of the year approaches, but then tend to lower their forecasts as the year progresses (becoming somewhat more realistic). In addition, asset allocators and hedge fund managers tend to take more risk at the end and beginning of a calendar year.
Beware, however. While market seasonality can be factored into a management process, it is only one factor among several others. Indeed, the "winter season" can, in some years, produce below-average or even negative results.
It is the cumulative gain and the average over time that are impressive. But there is no guarantee that "winter season" investors will consistently outperform the summer season.
It is therefore important to be aware of the seasonal bias of the stock markets, but also to take into account the fact that this is not an indicator in its own right.
Conditional seasonality
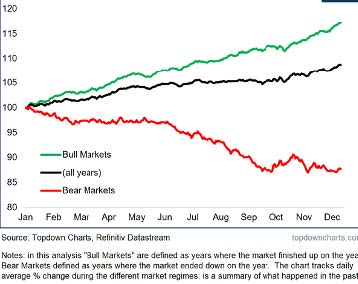
Thomas Callum, founder of Topdowncharts.com, analysed what he calls conditional seasonality.
He rightly reminds us that seasonality analysis is based on periods of mixed market regimes, i.e. bullish and bearish periods. As we are currently in a bear market trend, it seems appropriate to study seasonality during comparable historical periods.
To help answer this, Thomas Callum has carried out an analysis of historical data but separated the bull and bear market phases (defined here as when the market closed the year up or down).
What are the results?
Firstly, he finds that the bull market curve has tended to rise throughout the year, which makes sense. Similarly, the bear market curve tends to decrease throughout the year.
What is more surprising is that the old adage "sell in May and go away" was simply not present during the bull markets, and really only exists during the bear markets.
In other words, the seasonality of equity markets (i.e. avoiding equity markets between May 1 and October 30) works best in bear markets.
Furthermore, it should be noted that the equity market trend that performed well at the very end of the year seems to work only moderately in bear markets.
In essence, this means that one should remain "bullish" in a bear market and remain "bearish" in a bear market.
S&P 500 confitional seasonality
Conclusion
Seasonality remains one of the few market inefficiencies that can be exploited by portfolio managers. However, it is less effective in down markets. It is therefore recommended to use it with some caution in the current market context.