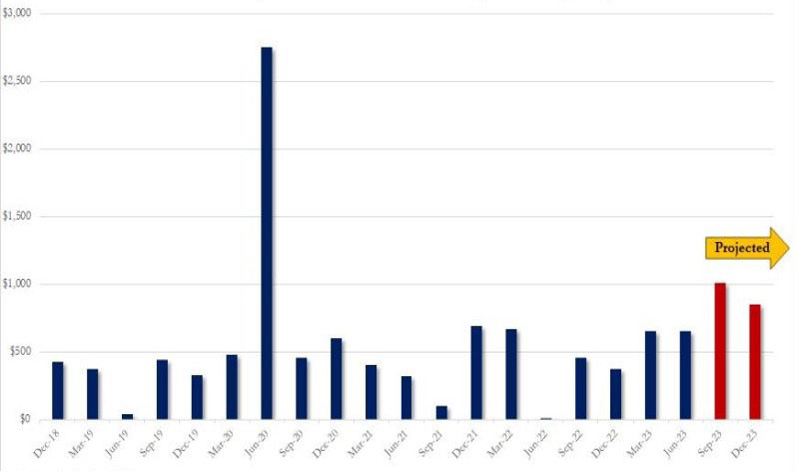
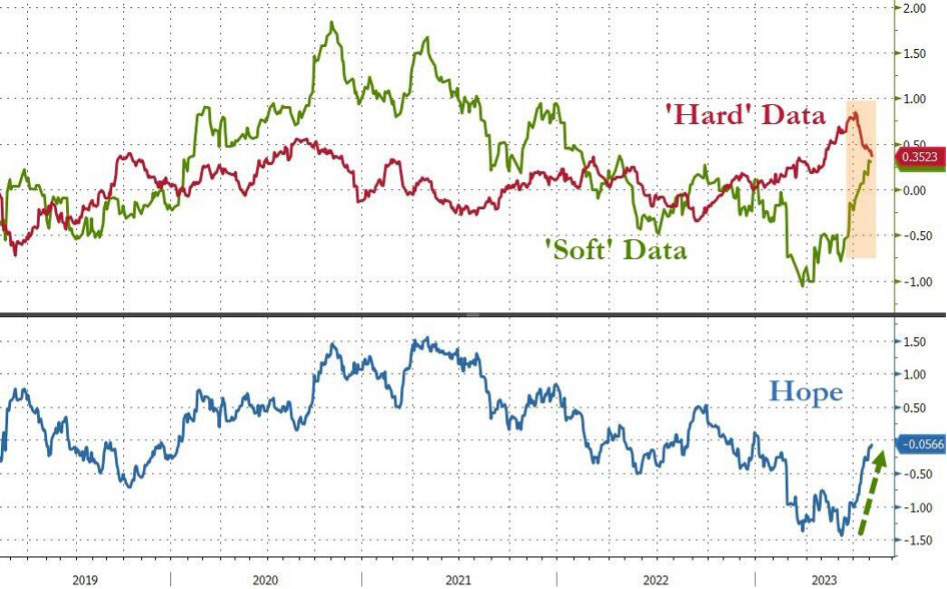
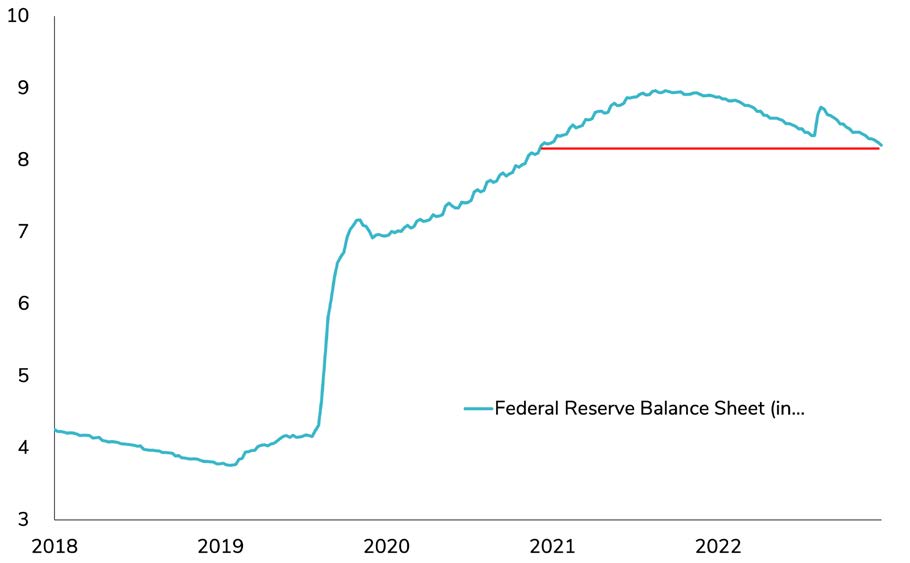
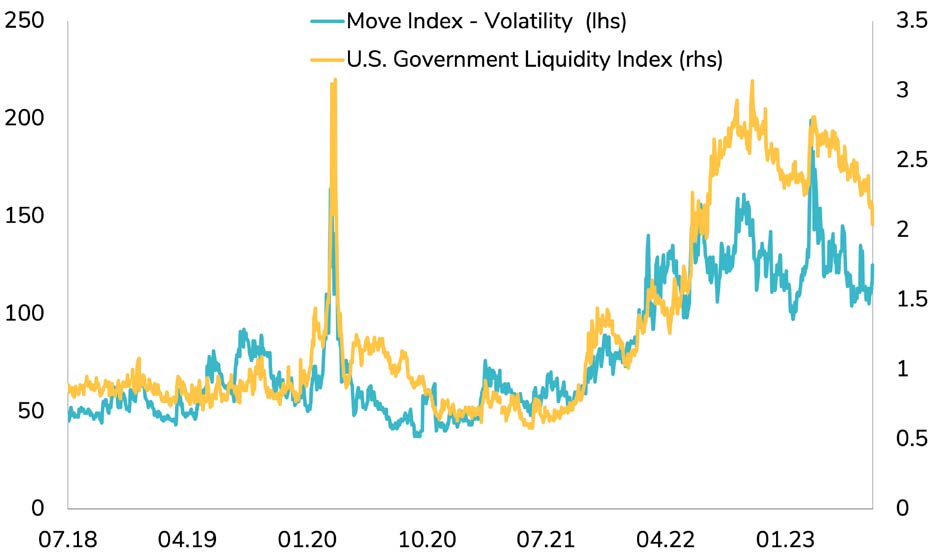
Navigating the Storm: The recent sharp sell-off in US Treasuries presents both challenges and opportunities for investors. While supply pressures, economic strength, and tightening liquidity have pushed yields higher, attractive valuations, potential inflation cooling, and favorable market positioning offer opportunities.Our investment view on US Treasuries suggests a cautious yet strategic approach.

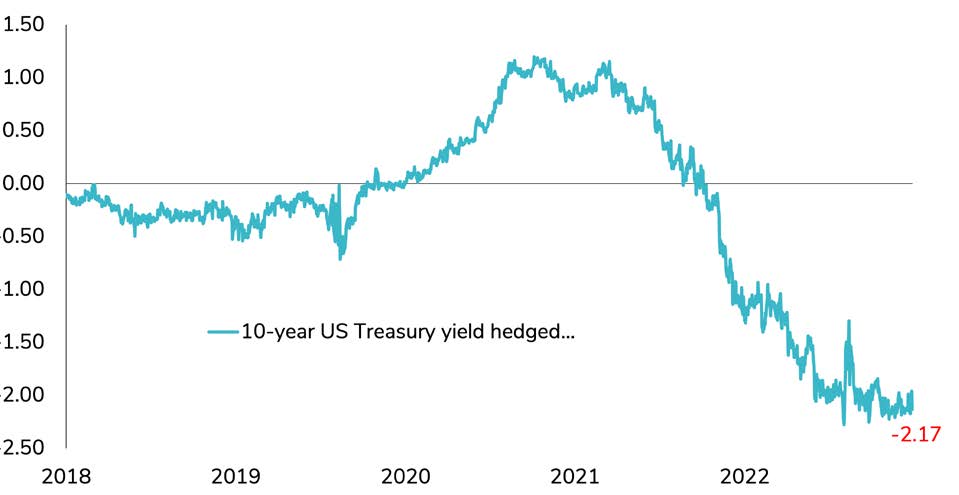
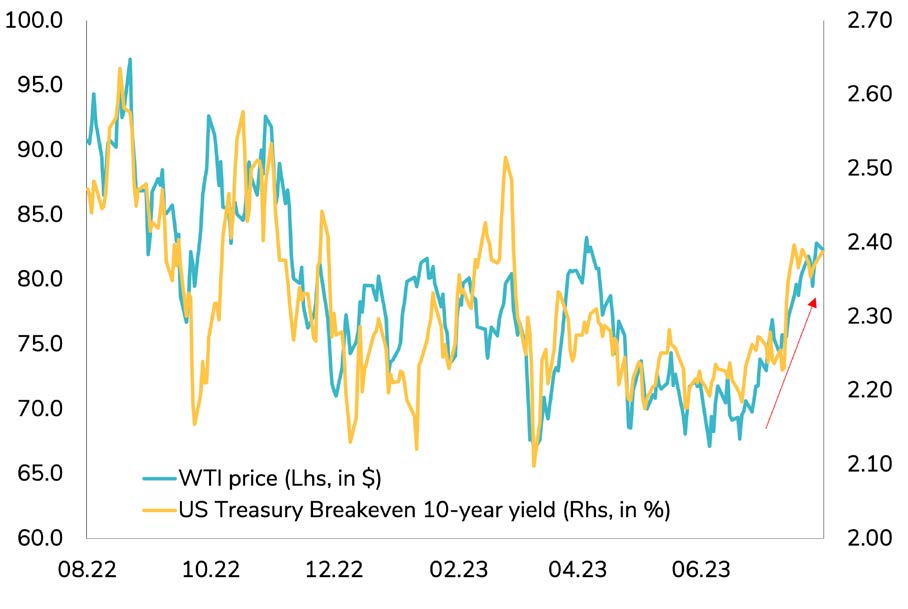
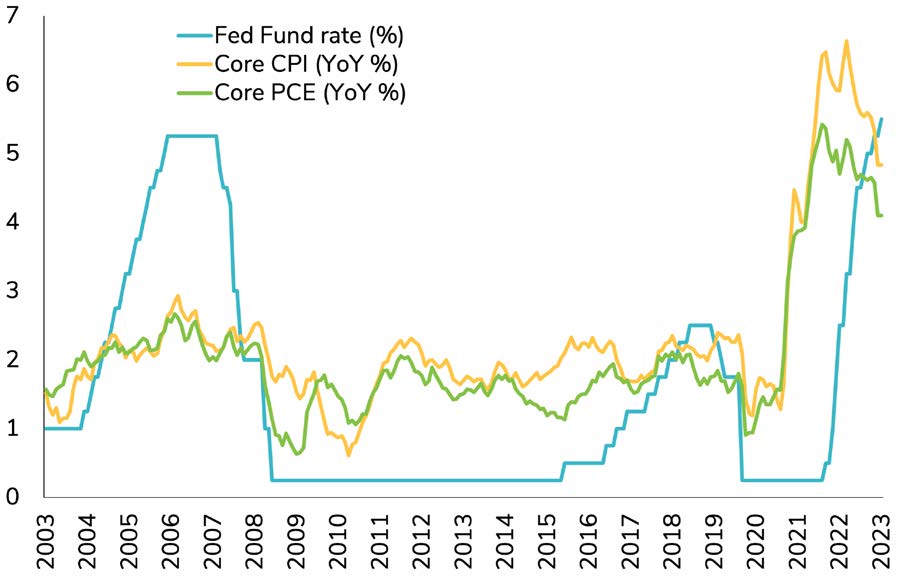
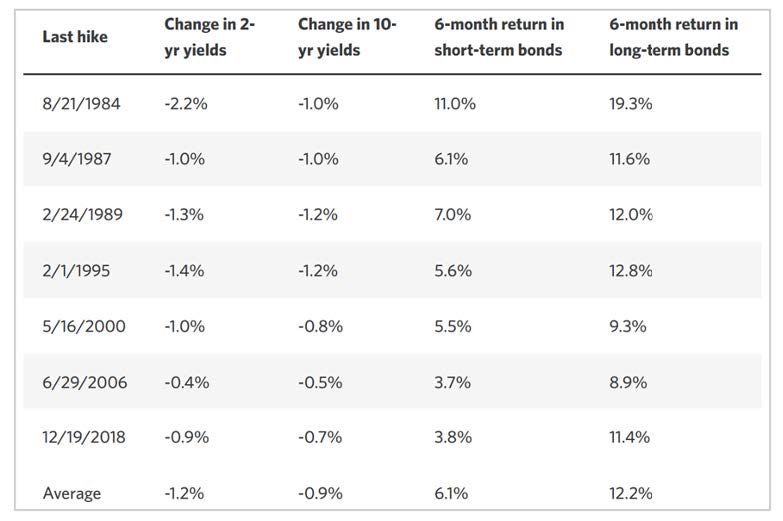
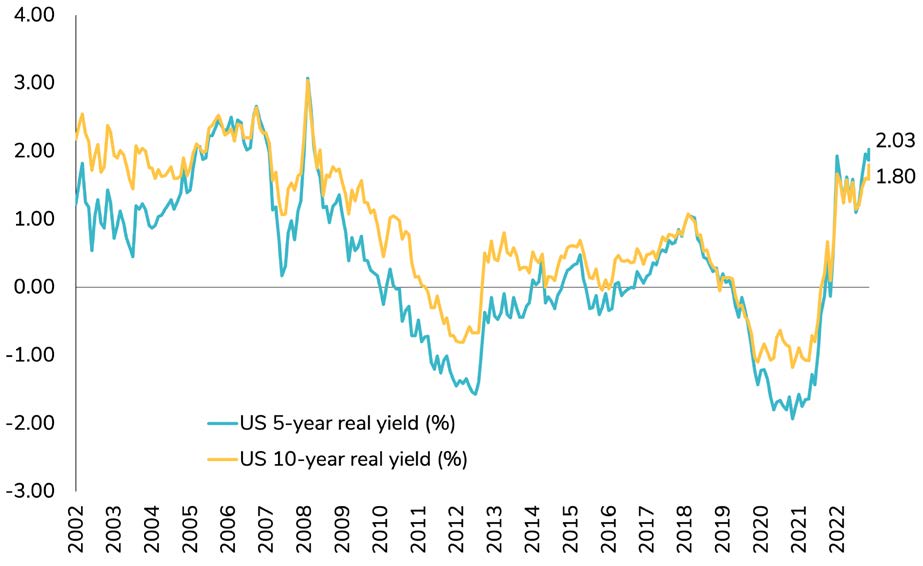
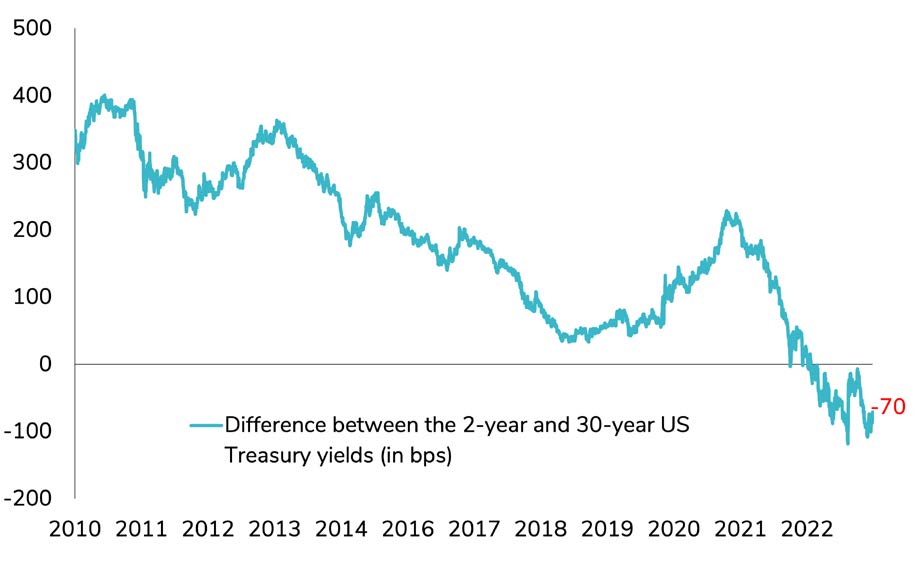
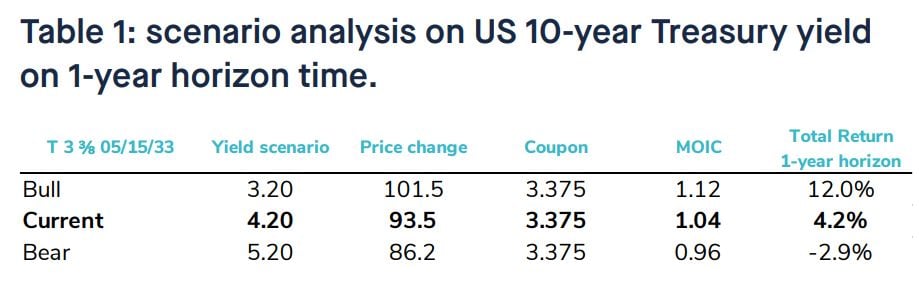
Focusing on the belly of the yield curve (around 5 to 10-year maturities) offers attractive entry points with historically high real yields. We remain cautious on the long end, given the market's interest in repricing the steepening trend. However, the current historically high yields also provide an excellent opportunity to lean in on duration. By complementing short-term bonds and cash with long-term fixed income, investors can take advantage of attractive yield levels while managing interest rate risks. Inflationary pressures are abating, potentially signaling an end to the Federal Reserve's rate-hiking cycle, with the upside potential for yields now outweighing downside risks.

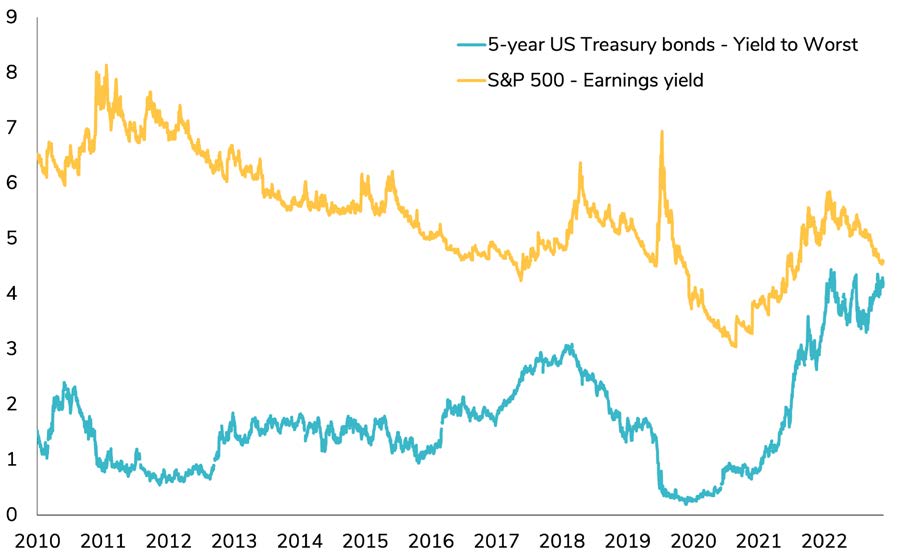
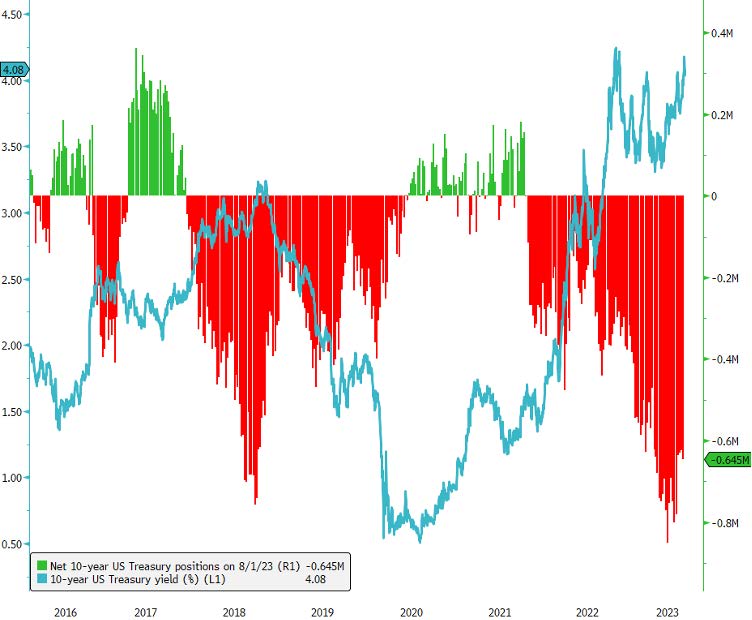
Market's short positioning on US 10-year Treasuries suggests a potential turnaround, favoring fixed-income investments. Additionally, the normalization of correlation between bonds and equities strengthens the case for bond investments in multi-asset class portfolios.
In conclusion, the recent sell-off in US Treasuries demands prudence and discernment. Selective positioning in the belly of the yield curve, along with a duration tilt, can seize opportunities amidst the storm. Monitoring inflation trends and Federal Reserve policy will be critical in making informed investment decisions as market dynamics evolve.


In depth analysis

In the world of global finance, US Treasuries have long been considered a safe haven for investors seeking stability and liquidity. These government-issued bonds are widely regarded as a benchmark for risk-free assets, often used as a foundation for building diversified investment portfolios. However, in recent times, the tranquility that once enveloped the US Treasury market has been disrupted by a significant sell-off starting in 2020. Despite a respite in 2023, recent factors have propelled the 10-year US Treasury yield from 3.3% in May 2023 to 4.2% at the start of August 2023, representing a jump of about 90bps. As investors are still recovering from the 2022 fixed income performance, the new sharp selloff raises the question of whether it poses a new threat for bondholders or an opportunity to seize? 


Unraveling the sell-off - factors contributing to the recent rise in US Treasury.

We have identified a few factors which affected the recent rise in US Treasury yields:  


1. The Bank of Japan's shift: unraveling the impact


The recent rise in the yield on Japanese 10-year government bonds to 0.65%, its highest level since January 2014, marks a significant development. This surge was triggered by a  notable shift in the monetary policy of the Bank of Japan (BOJ), allowing the 10-year yield to move higher, potentially up to 1%. This departure from their previous policy of holding yields at negative levels signifies a normalization of BOJ's monetary policy, specifically easing of the yield curve control mechanism.

The implications of this policy tweak are far-reaching, especially for the US Treasury market. Institutional investors from Japan, who hold substantial assets, may respond by selling other government bonds to invest in their domestic market. Consequently, there is reduced demand for US Treasuries from Japanese investors, adding to the upward pressure on Treasury yields. A significant factor to consider in this context is the widening swap adjusted yield gap between Japanese Government Bonds (JGBs) and US Treasuries.

The divergence in yields makes Japanese investors less inclined to invest in US Treasuries. Additionally, if energy prices continue to rise, Japan's payment for energy in US dollars might further increase the likelihood of the BOJ selling USTs, potentially impacting Treasury yields.

Chart 1: Yield of a 10-Year US Treasury Bond after Currency Hedging for Japanese Investors.

chart 1-1

Source: Bloomberg

2. Treasury supply surge: a looming threat


The US Treasury's recent announcement of revised bond sales sent shockwaves through the market. Driven by a surge in budget deficits, the Treasury made an unprecedented move by increasing the size of its quarterly bond sales for the first time in 2 1/2 years. To finance the escalating deficits, a staggering $1 trillion in debt is set to be sold this quarter, marking the second-highest issuance in history, second only to the Covid-related $2.753 trillion in Q2 2020. Additionally, another substantial offering of $852 billion is anticipated in 4Q23.

The flood of Treasury bonds into the market has created downward pressure on their prices and, in turn, exerted upward pressure on yields. As supply outpaces demand, investors grapple with the potential implications for their portfolios. Looking ahead, the Treasury has acknowledged that further gradual increases in auction sizes will likely be necessary to align with intermediate to long-term borrowing needs.

Chart 2: Treasury marketable borrowing needs ($bn)

chart 2-1

Source : Zerohedge, US Treasuries


3. Economic resilience and commodity surge 

The US economy has exhibited remarkable resilience, defying market expectations amid a 500bps hike in the last two years. Contrary to concerns that the rate hiking cycle would adversely affect economic growth and employment, the unemployment rate has actually fallen below its levels when the cycle began. Moreover, the economy continues to display robust growth, with the Atlanta Fed's real-time GDP growth forecast tracking close to 4% for the third quarter, a significant deviation from the conservative 0.5% consensus estimate. Federal Reserve Chairman Jerome Powell's comments during the last FOMC meeting have further bolstered confidence in the economy.

He suggested that recession risks for 2023 were diminished, and the central bank's principal economic scenario points toward a soft landing. This shift in sentiment has prompted investors to contemplate the possibility of the Fed maintaining higher interest rates for an extended period, which, in turn, can influence Treasury yields.

Chart 3: reversal in soft data indicators over the last few months

chart 3-2

Source: Bloomberg

In parallel, the recent surge in commodity prices has added another dimension to the economic landscape. Commodity markets, particularly driven by higher oil prices, have experienced a notable rebound, impacting inflation expectations (Chart 4). As inflation expectations rise, the potential trajectory of interest rates becomes a pivotal consideration for investors in shaping their Treasury yield outlook.

Chart 4: US 10-year breakeven yield rates and oil prices

chart 4-2

Source : Bloomberg

4. Escalating liquidity tightening: Federal Reserve's shrinking balance sheet

The Federal Reserve's quantitative tightening has gained momentum, resulting in a contracting balance sheet (Chart 5). In July, the Fed's balance sheet experienced a significant reduction of $91 billion, bringing the total decline from its peak to a staggering $759 billion. This unprecedented drop marks the largest decline on record, leaving the balance sheet at $8.2 trillion, its lowest level since July 2021. The tightening of liquidity, as evidenced by the shrinking balance sheet, carries implications for the financial markets, particularly the US Treasury bond market. With reduced liquidity in the system, investors grapple with potential impacts on borrowing costs and market stability.

Chart 5: Continuing contraction of the Federal Reserve balance sheet

chart 5-2

This reduction in liquidity, coupled with the elevated volatility in the US Treasury bond market (as evidenced by the MOVE index), has raised concerns among investors (Chart 6).

Chart 6: Ongoing concerns regarding volatility and liquidity in the US Treasury bond market

chart 6-1

Source: Bloomberg

The recent sharp sell-off in US Treasuries has been driven by a confluence of factors, including notable policy shifts in Japan, a surge in Treasury supply, economic strength, rising commodity prices, and the Federal Reserve's quantitative tightening. As we navigate these turbulent waters, it becomes imperative to carefully consider the implications of these factors on the bond market and investment strategies.


Charting a course - our view on US Treasuries investments after this sell-off 

In this section, we will present our investment outlook on US Treasuries in light of the recent sell-off and the prevailing market conditions. We will assess potential opportunities that arise from the current market dynamics and identify prudent strategies to navigate the challenges posed by the changing economic and financial landscape. By carefully analyzing the implications of key factors, we aim to provide valuable insights that will help investors make informed decisions and optimize their portfolios amid the ever-evolving US Treasury market.

1. The fitch downgrade: short-term market impact minimal.

Despite Fitch downgrading the United States' long-term foreign currency debt rating from AAA to AA+, the US sovereign risk remained largely unaffected in the short run. As evidenced on Chart 7, the Credit Default Swap (CDS) on 1-year US Treasury remained unchanged on the news.

The market's subdued reaction to the downgrade indicates that investors have not perceived an immediate increase in the credit risk of US Treasuries.

Chart 7: United States 1-year CDS (in bps)

chart 7-2

Source: Bloomberg, Zerohedge 

2. Inflation downtrend and restrictive monetary policy: an opportunity for long-term investors

The recent rise in yields in US Treasuries presents an opportunity for long-term investors who are willing and able to withstand volatility. One of the most significant concerns related to higher yields is inflation, but the recent developments indicate a positive trend. Inflation has been cooling off, and the current monetary policy is in restrictive territory (Chart 8).

Chart 8: Fed monetary policy and US inflation measures

chart 8-1

Source : Bloomberg


Chart 9: 6-month return in US Treasuries bonds after the last hike. 

chart 9

Source: Edward Jones

3. Attractive valuations with caveats across the yield curve.

The current valuation of US Treasuries appears attractive, particularly as real yields have reached historic highs. Chart 10 demonstrates that real yields in 5-year and 10-year US Treasuries offer very attractive entry points compared to historical levels.

Chart 10: US real yields (%)

chart 10

Source : Bloomberg


However, it is important to exercise caution when evaluating the long end of the US Treasury curve. The market appears to be in the process of repricing the steepening of the yield curve, with a particular focus on the long-term segment. The Federal Reserve's stance of not considering a cut in short-term interest rates until at least the second half of 2024 adds to the uncertainty surrounding the longer end of the curve. The heightened volatility in the long-term US Treasury (UST) yield curve may impact performance, leading us to limit our investments to maturities up to 10 years for now. We await a more pronounced yield curve steepening before reconsidering investments in the long end.

Chart 11: the US Treasury yield curve is still largely inverted 

chart 11

Source : Bloomberg

In a relative context, government bond valuations hold substantial appeal, as they are currently positioned as the most attractive compared to stocks in decades. This is evident in the narrow gap between the earnings yield of the S&P 500 and the yield on 5-year Treasuries, which is close to zero and has not been observed since 2002.

Chart 12 : Difference between the yield of the 5-year US Treasury and the earning yields of the S&P 

chart 12

Source : Bloomberg

4. Symmetry of risk favors bond investors

Currently, the convexity favors bond investors, indicating that the potential upside is higher than the downside. To illustrate, let's consider the 10-year US Treasury with a yield of 4.20%. Conducting a scenario analysis over a 1-year time horizon reveals a clear asymmetry in favor of the upside compared to the downside. For instance, if in 1 year, the 10-year US Treasury yield rises to 5.20% (a 100bps yield increase), the potential loss would be limited (table 1).
This favorable risk profile suggests that there is more potential for bond prices to rise than to decline, providing an attractive opportunity for bond investors. 

table 1

Source: Bloomberg, Syz


5. Futures support on US government bond investments

Additionally, we have identified two potential factors that could positively impact the future performance of US government bonds. The first factor is the current market positioning, which continues to be on the short side (Chart 13). A reversal in the market sentiment could potentially bolster bond performance. Currently, shorting US 10-year bonds appears to be one of the most crowded trades, as evidenced by the record-high net short positions of non-commercial traders.

A market turnaround, wherein investors shift from short positions to long positions, could drive an upswing in bond prices. This scenario presents an opportunity for bond investors to capitalize on potential gains as market dynamics evolve. 

Chart 13: Non-commercial net position on 10-year US Treasuries. 

chart 13

Source: Bloomberg

One of the most critical themes for a multi-asset class portfolio is the correlation between bonds and equities. Throughout 2022, the correlation between these two asset classes was positive, significantly impacting the performance of balanced portfolios. However, in the first half of 2023, it turned negative before recently returning to positive territory. This dynamic relationship between bonds and equities plays a pivotal role in portfolio diversification and risk management. When the correlation between bonds and equities is positive, both asset classes tend to move in the same direction, which can limit the benefits of diversification.

This alignment may result in reduced risk mitigation and potential losses during market downturns. On the other hand, a negative correlation implies that bonds and equities move in opposite directions, offering enhanced portfolio diversification and the potential to reduce overall volatility. During such periods, investors may benefit from the cushioning effect that bonds provide when equities experience volatility.

As we closely analyze market trends and anticipate potential shifts, we believe that the correlation between bonds and equities could potentially turn negative once again. This development could offer a favorable environment for multi-asset portfolio managers, presenting opportunities for strategic asset allocation and risk management.


Disclaimer

This marketing document has been issued by Bank Syz Ltd. It is not intended for distribution to, publication, provision or use by individuals or legal entities that are citizens of or reside in a state, country or jurisdiction in which applicable laws and regulations prohibit its distribution, publication, provision or use. It is not directed to any person or entity to whom it would be illegal to send such marketing material. This document is intended for informational purposes only and should not be construed as an offer, solicitation or recommendation for the subscription, purchase, sale or safekeeping of any security or financial instrument or for the engagement in any other transaction, as the provision of any investment advice or service, or as a contractual document. Nothing in this document constitutes an investment, legal, tax or accounting advice or a representation that any investment or strategy is suitable or appropriate for an investor's particular and individual circumstances, nor does it constitute a personalized investment advice for any investor. This document reflects the information, opinions and comments of Bank Syz Ltd. as of the date of its publication, which are subject to change without notice. The opinions and comments of the authors in this document reflect their current views and may not coincide with those of other Syz Group entities or third parties, which may have reached different conclusions. The market valuations, terms and calculations contained herein are estimates only. The information provided comes from sources deemed reliable, but Bank Syz Ltd. does not guarantee its completeness, accuracy, reliability and actuality. Past performance gives no indication of nor guarantees current or future results. Bank Syz Ltd. accepts no liability for any loss arising from the use of this document.

Read More

Straight from the Desk

Syz the moment

Live feeds, charts, breaking stories, all day long.

Thinking out loud

Sign up for our weekly email highlighting the most popular posts.

Follow us

Thinking out loud

Investing with intelligence

Our latest research, commentary and market outlooks