


Introduction
Three years ago we argued that the active-versus-passive question was badly framed: both approaches have merit, and what matters is where and when each works better. That conclusion still stands. What has changed is the market around it. Passive equity assets have overtaken active; index concentration has reached record levels in the US and, more surprisingly, in emerging markets; and in fixed income, market-value weighting means that the more a government borrows, the larger its benchmark weight - just as investors begin to question sovereign creditworthiness.
The principles, and what the evidence says
Passive management replicates an index, typically by holding its constituents at index weights, on the efficient-market logic that after costs the average investor cannot beat the market, so the rational strategy is to own it cheaply. Active management deliberately departs from index weights, betting that mispricings exist, and that a skilled investor can exploit them.
Index funds now own about a fifth of the average listed US company. Less noticed, the wrapper has itself become a vehicle for active management, with actively managed ETFs reaching a record USD 2.6 trillion in July 2026. "Passive" and "ETF" are no longer synonyms; the debate is now about what sits inside the wrapper.
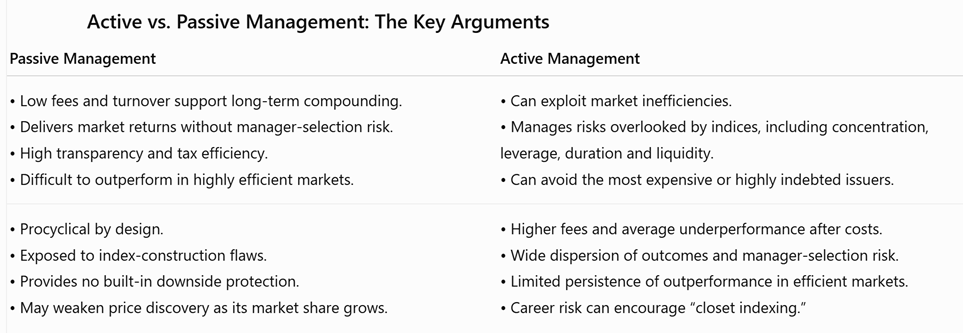
Two of these arguments were marginal in 2023 and have become central today. A cap-weighted equity index is a momentum strategy in disguise, allocating most capital to whatever has already performed best; a market-value-weighted bond index, less intuitively, allocates most to whoever has borrowed most. And buying the index casts no vote on capital allocation: passive works only because active investors do the work of pricing securities, so if enough capital stops questioning prices, mispricings widen instead of narrowing.
The headline evidence nonetheless remains unambiguous. Over fifteen years, roughly 90% of active US large-cap funds trail the S&P 500. Morningstar, which measures managers against investable passive funds net of fees rather than against an uninvestable index, finds that only 21% of active funds across all categories both survived and beat their average passive peer over ten years.
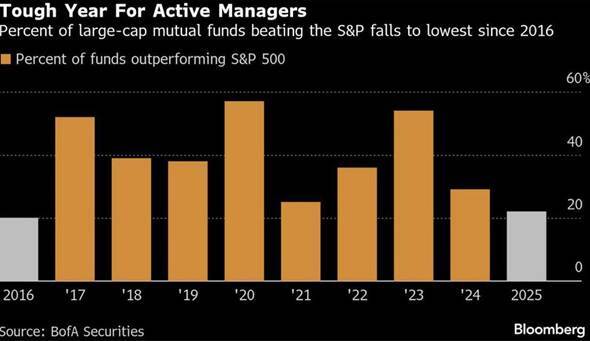
Source: BofA
But the average hides where the value is. Category results reproduce the efficiency pattern almost exactly.
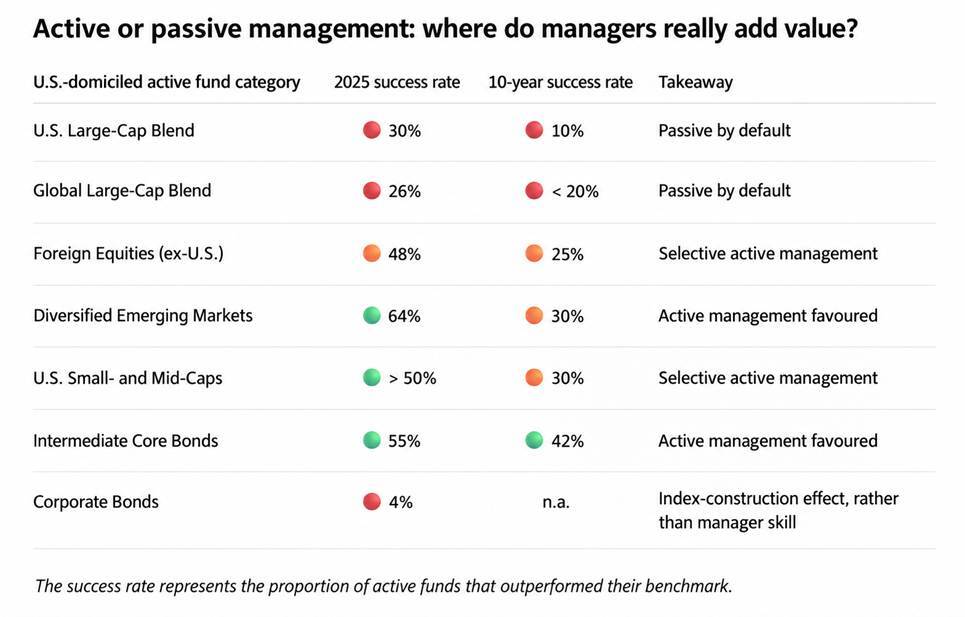
Source: Morningstar US Active/Passive Barometer, year-end 2025; SPIVA US Scorecard year-end 2025. Success rate = share of active funds that survived and outperformed the average passive fund in the category; ten-year figures approximate.
The corporate-bond result reflects passive funds sitting in the curve's five-to-seven-year sweet spot in 2025, an advantage almost no manager could overcome on top of the fee gap.
Morningstar's European barometer, covering nearly 32,000 funds, shows the same shape: bond categories above 55%, emerging market equity near 50%, UK and European large caps well below 30%. Fees remain the single best predictor of success - in 16 of 20 categories a manager in the cheapest quintile improves the odds - and dispersion is wide and, in the less efficient categories, positively skewed, so the reward for a good manager exceeds the penalty for a poor one. Selection is not a lottery but work, to be concentrated where the payoff is highest.
What has changed: concentration, leverage and the illusion of diversification
If average performance argues for passive management in efficient markets, what the indices now contain argues against accepting them uncritically.
The US index is a bet on ten companies and one theme. The ten largest S&P 500 stocks make up 38% of the index, a record, and far above the dot-com peak. Nvidia alone reaches 8%, the largest single weight since data began in 1981; with Apple and Microsoft, roughly 18%. Unlike in 2000, all ten are tied to a single theme, artificial intelligence, so their fortunes are correlated. The investor who thinks he owns "the US market" owns a concentrated, momentum-driven portfolio whose weights are reinforced by inflows, regardless of fundamentals. Earnings justify part of that concentration, since the top ten generate a disproportionate share of index profits. But holding the index is an active choice with a specific risk profile, and should be handled as such.
Emerging markets are now more concentrated than the US. The starker shift is in the asset class bought for diversification. TSMC alone is 14% of the MSCI EM Index, more than every Indian stock combined. With Samsung Electronics and SK Hynix, three semiconductor companies represent 26% of the benchmark, while the top ten represent 38%; ten years ago the largest constituent was 3% and the top ten was 23%. Taiwan has overtaken China as the largest country weight, and information technology approaches 37%. Today's EM benchmark is effectively a leveraged play on AI hardware with a China overlay: the theme dominating the S&P 500, held through different tickers. Copley data show 93% of EM funds own TSMC, so the crowding is universal. That EM was 2025's best category for active managers is no coincidence: it is where the index has strayed furthest from what investors think they are buying.
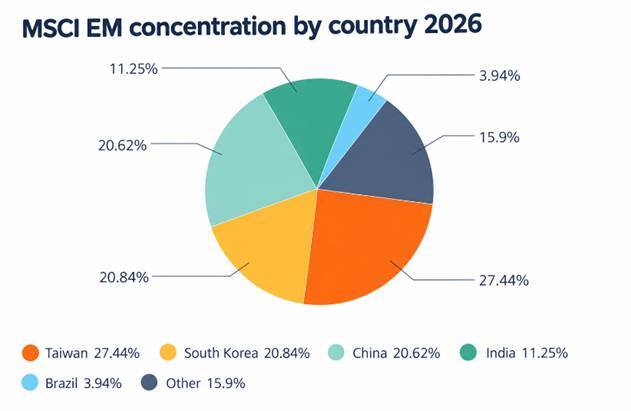
Source: MSCI
Bond indices reward the most indebted. Equity indices weight by market capitalisation, which at least reflects a judgement about value. Bond indices weight by the market value of debt outstanding - by how much each issuer has borrowed - so the more a government issues, the larger its benchmark share and the more a passive investor must buy. The BIS warns that this weakens market discipline and can encourage leverage. That was academic when sovereign balance sheets were sound and yields near zero. G7 debt-to-GDP ratios and debt-service costs have since roughly doubled, and Treasuries' weight in the US Aggregate rose from 25% to 39% in the decade to 2019 and keeps climbing. In 2026, with long-dated yields at multi-decade highs in the US, Japan, the UK and France, the largest weights in a global government bond index are precisely the issuers whose fiscal trajectories worry investors most - a structural overweight of the weakest debt dynamics and, since heavy issuers issue long, of duration too. GDP-weighted and debt-capacity indices have outperformed market-value peers since Covid, but the more robust answer is active management: underweighting over-indebted issuers, managing duration and rotating along the curve is exactly what a debt-weighted index cannot do.
A pragmatic framework
An open-architecture approach makes it possible to combine both styles. While the underlying principles remain unchanged, only the balance between them evolves.
Passive management is generally preferred where markets are efficient and indices are well constructed. US and global large-cap developed equities remain the clearest case: the odds of selecting a manager who beats the index after fees are roughly one in ten over a decade. But passive investing still requires a deliberate choice of index. Where concentration has become extreme, equal-weight, capped or quality-screened versions of the benchmark can be legitimate alternatives, while a cap-weighted tracker should be treated as the concentrated bet it has become.
Active management tends to be more relevant where inefficiencies persist and indices are less representative: emerging markets, small and mid caps, and core and flexible fixed income. In fixed income, debt-weighted passive exposure can represent a structural risk rather than a neutral core allocation, favouring managers with explicit freedom to deviate from issuer weights. Across both approaches, due diligence should focus on costs and the ability to generate value net of fees. Where the best available manager is unlikely to deliver alpha, passive is generally preferable. The strategy matters more than the label: many active approaches now offer the liquidity, transparency and cost profile once associated primarily with index funds.
What no index can determine is the shape of the portfolio itself. Even a broad benchmark such as the MSCI World represents only one asset class, saying nothing about the allocation between equities and bonds, currency hedging, or the role of alternatives. Rules-based multi-asset funds address part of this gap, but at the cost of customisation. This is where portfolio construction adds value beyond the benchmark: distinguishing markets where active management can justify its fees from those where it cannot, identifying capable managers, understanding how strategies behave through drawdowns and regime shifts, and rebalancing as conditions change rather than after performance has already reflected the shift.
Conclusion
The data are as clear as they were in 2023: the average active manager underperforms, and in the most efficient markets low-cost indexing is hard to beat. But the indices themselves are no longer what they were. In equities they have become concentrated bets on a single theme, in the US and, more surprisingly, in emerging markets. In fixed income they mechanically overweight the most indebted borrowers just as creditworthiness is in question. Accepting such benchmarks without examination is itself an active decision.
Disclaimer
This marketing document has been issued by Bank Syz Ltd. It is not intended for distribution to, publication, provision or use by individuals or legal entities that are citizens of or reside in a state, country or jurisdiction in which applicable laws and regulations prohibit its distribution, publication, provision or use. It is not directed to any person or entity to whom it would be illegal to send such marketing material. This document is intended for informational purposes only and should not be construed as an offer, solicitation or recommendation for the subscription, purchase, sale or safekeeping of any security or financial instrument or for the engagement in any other transaction, as the provision of any investment advice or service, or as a contractual document. Nothing in this document constitutes an investment, legal, tax or accounting advice or a representation that any investment or strategy is suitable or appropriate for an investor's particular and individual circumstances, nor does it constitute a personalized investment advice for any investor. This document reflects the information, opinions and comments of Bank Syz Ltd. as of the date of its publication, which are subject to change without notice. The opinions and comments of the authors in this document reflect their current views and may not coincide with those of other Syz Group entities or third parties, which may have reached different conclusions. The market valuations, terms and calculations contained herein are estimates only. The information provided comes from sources deemed reliable, but Bank Syz Ltd. does not guarantee its completeness, accuracy, reliability and actuality. Past performance gives no indication of nor guarantees current or future results. Bank Syz Ltd. accepts no liability for any loss arising from the use of this document.
Related Articles
Why a more efficient model means more AI infrastructure, not less
$100bn in investment, $209bn in projected state revenue, 65 billion barrels of oil. The figures attached to the new US-Venezuela deal are as large as the uncertainty surrounding them.
Investors have always listened carefully to what CEOs and CFOs say. But the sheer volume of earnings-call transcripts made systematic analysis virtually impossible: investors could read individual calls, but not reliably extract and compare narratives across thousands of companies. AI changes that.


