

.png)
Chart #1 —
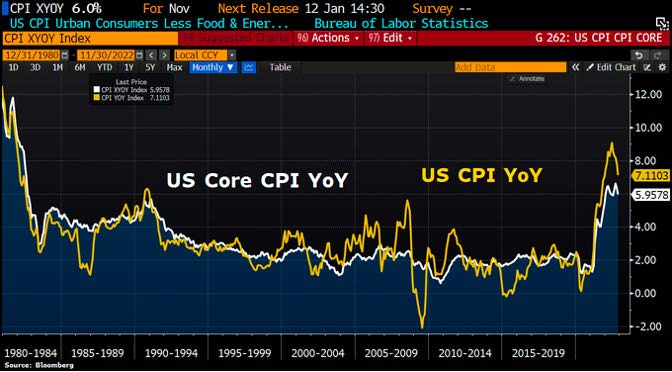
US inflation rate surprises on the downside
Inflation numbers continue to move in the right direction. The headline CPI for November came in below consensus expectations, with a sequential increase of 0.1% and a year-over-year increase of 7.1%, the lowest rate since December 2021. The inflation rate excluding energy and food was also weaker than expected with a sequential increase of 0.2% (vs. 0.3% expected) and a year-over-year increase of 6.0% (vs. 6.1%). This decline in the inflation rate can mainly be attributed to energy costs, medical care and used cars. But the good news is that this decline in prices is widespread. With the exception of housing (which lags rents and real estate prices), all major components of the price basket showed a smaller year-over-year increase in November than in October.
US CPI index yoy (yellow) and US core price CPI yoy (white)
Source: Bloomberg
Chart #2 —
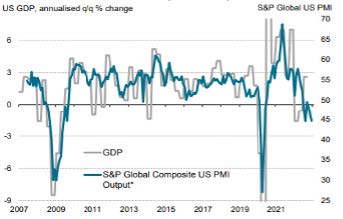
Disappointing US Macroeconomic figures
The U.S. Macroeconomic Surprise Index is once again in the red, demonstrating that the numbers released are overall below consensus expectations. Among the statistics released last week showing that the U.S. economy is on the verge of a major slowdown was the S&P Global composite purchasing managers' index for December. The index fell 1.8 points to 44.6, one of the worst readings since 2009. Another leading indicator was the Philadelphia index for December, which came out at -13.8 versus -10 expected. New orders continued to contract, prices fell (but are still expanding), delivery times fell, the average workweek is now firmly in contraction, and employment fell to its lowest level since June 2020. There was also a decline in industrial production in November: -0.2% sequentially (versus
0% expected) and -0.6% year-over-year (versus -0.2% expected). The last notable surprise of the week was retail sales, which fell by 0.6% in November, whereas a small increase was expected by the consensus.
S&P Global US Purchasing Managers' Index
Source: S&P Global, BEA
Chart #3 —
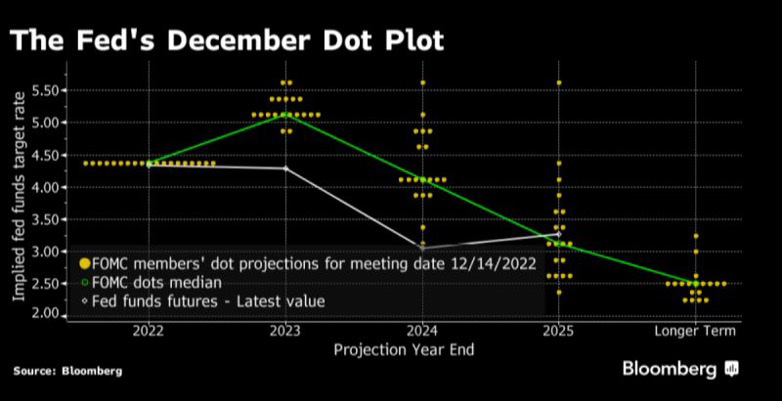
US Federal Reserve hikes rates by 50 basis points
At its December meeting, the Fed raised policy rates by 50 basis points (as expected). The pace of rate hikes is therefore slowing down. The U.S. central bank raised its policy rate to 4.5%, the highest since 2007. The Fed's median forecast calls for rates to end next year at 5.1% (50 basis points above the previous median of 4.6%). The Fed's so-called "dots" forecast rates at 4.1% in 2024 - a level that is also higher than previously indicated. Prior to the decision, markets had expected rates to reach 4.8% in May. So the Fed's message about monetary policy in the coming months is overall rather restrictive.
The Fed's expectations for the level of rates in the coming months (median in green) versus market expectations (in white)
Source: Bloomberg
Chart #4 —
The European Central Bank (ECB) also hiked rates by 50 basis points
The U.S. Federal Reserve was not the only one to meet last week. As expected, the Bank of England raised its policy rate by 50 basis points to 3.5%, the highest rate since October 2008. Like the Fed, the Bank of England is slowing the pace of its rate hikes as the inflation rate has eased slightly. The Swiss National Bank (SNB) also raised interest rates by 50 basis points to counter the "continued spread of inflation. SNB officials raised the benchmark rate to 1%. The central bank expects inflation to be 2.4 percent in 2023 and 1.8 percent in 2024. These forecasts are therefore slightly higher than the previous ones (+2.3% and +1.7% for 2023 and 2024 respectively).
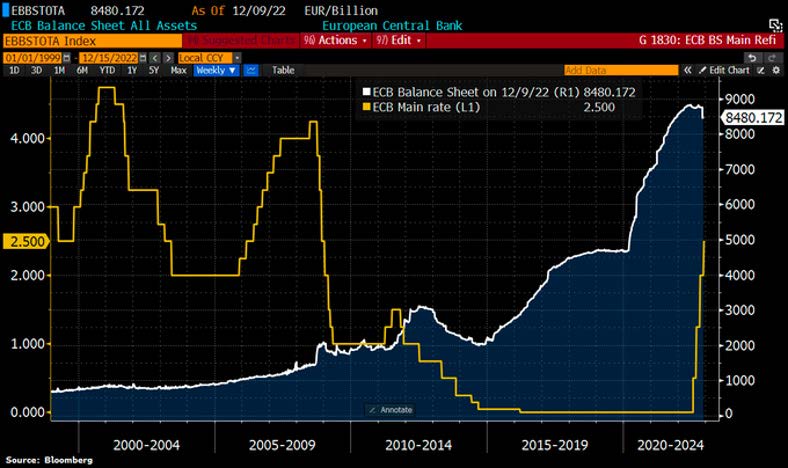
Finally, the European Central Bank (ECB) has also decided to slow down its pace of monetary tightening with a 50 basis point rate increase (in line with consensus expectations). The main refinancing rate is now 2.5%, the highest since 2009. The ECB stated that Quantitative Tightening (QT) will begin in March 2023 at a measured and predictable pace. The ECB says the portfolio built up over the years via the Asset Purchase Program (APP) will decline by an average of €15 billion per month in the second quarter of next year.
ECB policy rate (yellow) and central bank balance sheet size (white)
Source: Bloomberg
Chart #5 —
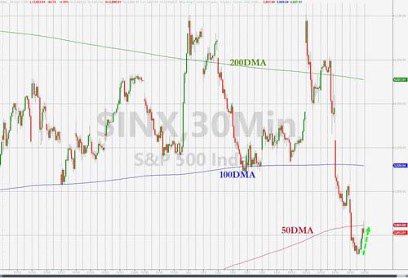
Another down week for the S&P 500, which is back below the 200, 100 and 50-day moving averages
Intensifying fears of rising interest rates and a sharp slowdown in economic growth pushed the S&P 500 Index lower for a second consecutive week. The leading U.S. market index is now trading at levels not seen since early November. Nearly every sector of the index is down for the week, at the exception of energy stocks, which were supported by a rebound in oil prices. The expiration of approximately $4 trillion in options contracts on Friday led to an additional increase in volatility.
It was noted that the S&P 500 level fell back below the 200-, 100- and 50-day moving averages.
S&P 500 Index versus 200, 100 and 50 day moving averages
Source: Bloomberg
Chart #6 —
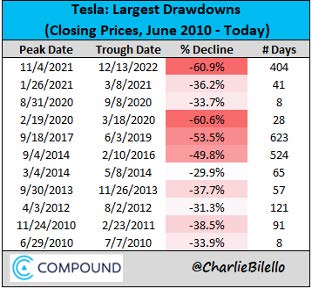
Tesla stock continues to fall
Tesla stock has lost about 10% on Wall Street this week as Elon Musk continues to sell off shares of the electric vehicle maker. The U.S. Securities and Exchange Commission announced that sales this time amounted to nearly $3.6 billion. Since the acquisition of Twitter, Elon Musk has to finance the restructuring of the social network. Tesla is down more than 60% since the November 2021 highs. This is the largest decline in its history.
Largest historical drawdowns for Tesla stock
Source: Charlie Bilello
Chart #7 —
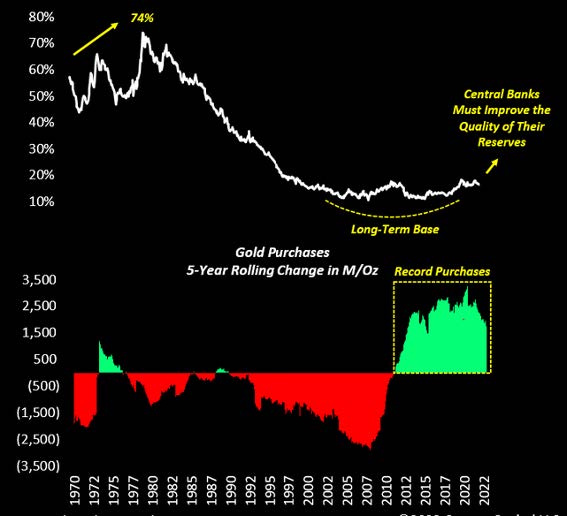
Central banks have accumulated record amounts of gold in 2022
This is probably one of the most important developments in global macroeconomics. Gold is becoming the preferred asset of central banks as they seek to improve the quality of their international reserves.
Gold as a percentage of central bank foreign exchange reserves (top chart) and gold purchases over 5 years (bottom chart)
Source: Crescat Capital, Tavi Costa, Bloomberg