
.png)
Our asset allocation preferences are based on 5 indicators, including 4 macro and fundamental indicators (leading) and 1 market dynamics (coincident). The weight of the evidence suggests a constructive view on equities (positive). Below we review the main drivers for each of them.
Pillar 1: Macro cycle
(POSITIVE)
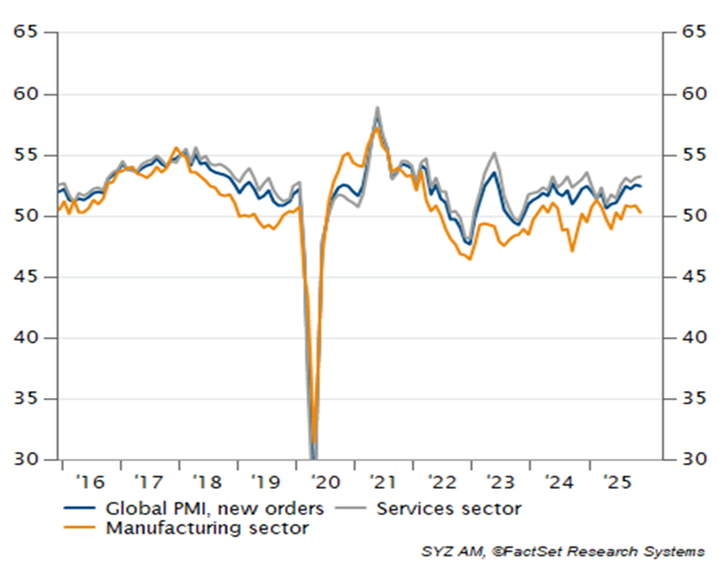
On a global scale, growth looks set to continue its economic recovery. The latest global economic activity indicators are pointing to a further, substantial recovery in the service sector, while manufacturing indicators hint at a modest, likely temporary slump in the pace of activity (see chart 1). We have witnessed some flare ups in trade tensions in the last months but overall, the level of uncertainty in the trade area remains low. However, the US Supreme Court did not yet decide on the legitimacy of the legal basis of the current US tariff regime, and it might well be, according to experts, that the US administration will have to recreate the legal foundation of its trade tariffs. This might cause more uncertainty again, but the potential effect on trade and economic performance remains vague. Over the longer term, a clarification of the legal basis should help reduce uncertainty further and the most important news, so far, is that there is no “tit-for-tat” negative spiral in the trade war, and that, up to date, global trade volumes remain very resilient against the US tariff shock.
Chart 1: Overall global economic activity leading indicators stay strong, but the manufacturing sector is still substantially lagging the service sector
However, the US Supreme Court verdict might be more important for US domestic politics as it could cut off the current administration of a revenue stream and potentially lead to a refund of some of the generated public tariff income. This would likely influence the amount of potential new fiscal stimulus that the government could distribute, including rebate checks–President Trump’s idea of sending a 2,000USD check to the mid and lower income households in the US, which would naturally have spurred consumption. Yet, when looking at the recent economic US data, the so-called purchasing manager indices (PMIs) point to a decent economic performance in the last quarter of 2025. Of course, the shutdown in the US will weigh on the Q4 economic activity—and its main measure, the gross domestic product (GDP)—but, aside from the government sector, we expect the business cycle to have performed well at the end of the year.
We witnessed some weaker data signals from the US labour market recently, particularly the uptick in the unemployment rate from 4.4% in September to 4.6% in November, and also the drop in jobs of more than 100,000 positions in October. However, this drop can be explained by the government job cuts that were already announced during the year—now executed by the DOGE in October. The good news was that the private sector did not experience fewer jobs on average and showed positive growth of more than 60,000 jobs in November, balancing out the negative news from October. We see the US labour market in a cooling-down phase, yet it remains on a solid footing and will likely settle into a new equilibrium with substantially lower labour demand but also reduced supply due to the latest changes in US immigration policies. In the same vein, we expect US household consumption to continue growing in 2026. We anticipate the price pressures in the US to remain elevated due to the solid demand by firms and households for goods and services. Of course, beyond a potential “freeze” in consumption —particularly if middle- and lower-income households in the US reduce their spending—several additional downside risks persist for the US economy: delayed tariff effects on prices and demand, further increases in electricity prices, and the growing debt burden of households and the government amid elevated interest rates.
Chart 2: US job growth took a hit in October, driven by the public sector, but November data was better than what the consensus expected
 Source: BLS, FactSet, Syz Group
The Eurozone’s GDP in the third quarter was a positive surprise as it revised further upwards and stands now at +0.4% compared to the quarter before. This is another important indication that Europe’s economy is on its path to recovery. The heavyweight Germany is still struggling with a zero-growth rate while France, which is in a period of political turmoil, posted a decent 0.5% growth rate. Southern countries showed a mixed picture with a GDP growth rate of only 0.1% in Italy but a strong rate of with 0.6% in Spain. Overall, Eurozone’s economic activity indicators hint at the continuation of a recovery. Despite the positive signs and the fiscal stimulus that we expect to filter into the economy in 2026, the Eurozone will still have to overcome the higher US tariffs, the euro strength, and elevated energy prices that slow the economic recovery. The ongoing war in Ukraine, France’s political turmoil, in combination with an uncertain governing coalition in Germany continue to be the main “domestic” risks to the recovery. Yet, in our base case, public spending in combination with a global rebound in the manufacturing cycle, should help to keep Eurozone’s economy on track for a further recovery.
Switzerland received the confirmation from the US that its import tariffs for many Swiss goods will drop down to 15% - the same tariff rate than the Eurozone. Also, this measure will take effect retroactively from mid-November. This is good news for the Swiss export sector and the economy, after the Swiss GDP contracted in the third quarter by half of a percentage point and more than expected. Yet, this negative result was less driven by the US tariff shock and more by increased energy imports following the shutdown of a nuclear power plant in Switzerland, as well as by a sharp downturn in pharmaceutical exports after these had previously been front-loaded. Although the tariff shock will continue to weigh on Swiss economic performance, the reduction in tariff rates and support from the SNB’s accommodative policy rates lead us to anticipate a very gradual but positive rebound of the Swiss economy over the coming quarters.
In China, the new “trade truce” between the US and China seems not to have supported China’s exports to the US while the export figures to the non-US trading partners surprised to the upside. Nevertheless, many Chinese economic data disappointed in the recent weeks. In addition, the government’s “anti-involution” campaign against overcapacities poses a risk to domestic growth, particularly in the industrial sector. The latest business sentiment numbers seem to confirm the uncertainty in the sector. However, we still expect both issues to be addressed by the government with additional fiscal stimulus that should help spur domestic demand. Yet, the ongoing economic and geopolitical rivalry with the US keeps uncertainty elevated and a final trade deal between the two superpowers is still missing, making further trade disputes a key risk factor to growth in China and financial markets in general.
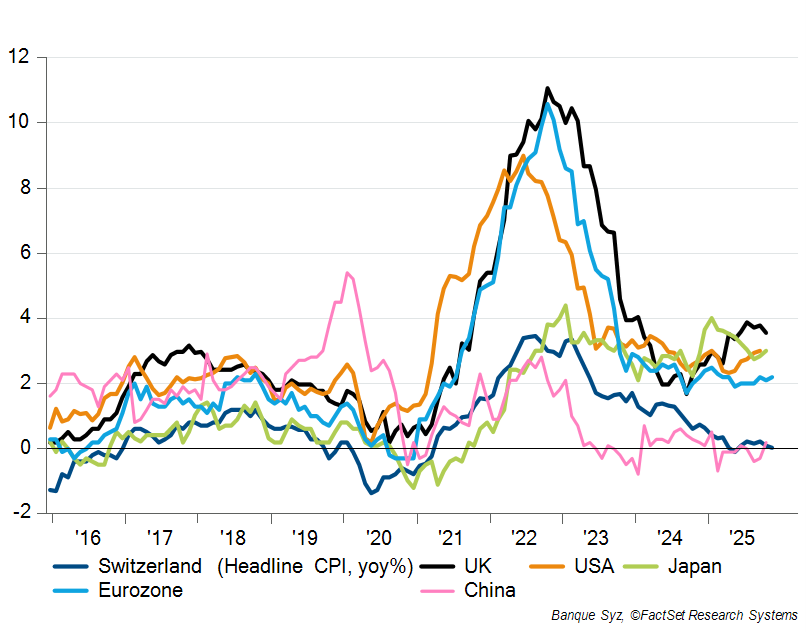
Chart 3: Inflation continues to be a story of two different speeds
Source: BLS, FactSet, Syz Group
Inflation appears to be a story of two different speeds. While the UK has an inflation rate above 3.5%, and the US and Japan at a rate of 3%, the Eurozone stays at slightly above 2% and China and Switzerland see inflation at 0.7% and 0%, respectively. Due to the shutdown, markets are still waiting for the inflation data from November (at the time of writing) while the US government said not to produce the October figures. Latest leading indicators like the ISM and the PMI price measures still point to elevated price pressures that even as the pass-through of tariffs is milder than expected, the underlying pressure in the domestic services sector remains evident.
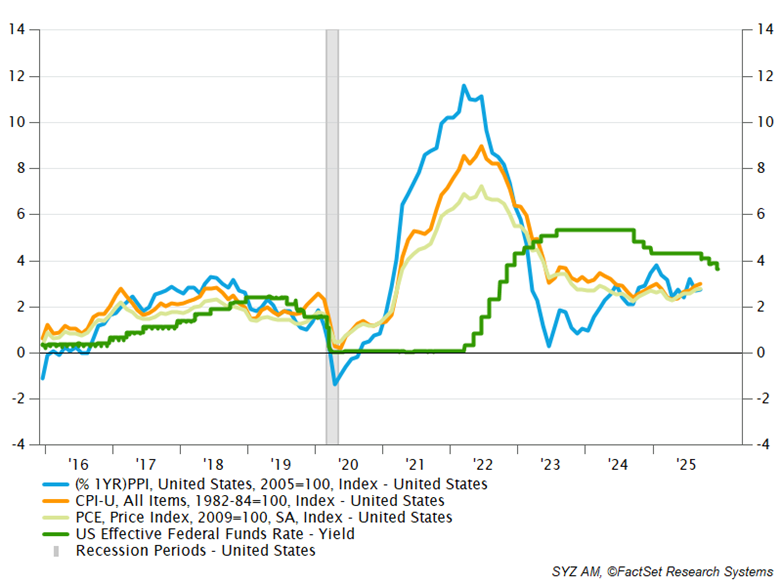
Nevertheless, US Fed delivered its third rate cut in December and Chair Powell delivered a less hawkish Q&A session than expected. Yet in his speech, he indicated that the Fed now views its current monetary policy stance as being at—or very close to—the neutral policy rate, that is, the interest rate that neither stimulates nor restrains the economy. As such, he said, the central bank is now in a “wait-and-see” mode. Accordingly, barring any further deterioration in labour market data or a slump in domestic consumption, we expect no additional rate cuts in the first quarter of 2026 at this stage. That said, it is important to bear in mind that over the coming weeks a significant amount of “new” data from the shutdown period will be released, helping to complete the economic picture for both the Fed and financial markets.
Chart 4: The US central bank cuts rate further despite inflation running at 3.0%
Source: BLS, FactSet, Syz Group
In the Eurozone we keep our view that inflation will remain tempered and float around the ECB’s target of 2%, at least until the economic recovery gains more traction later in the year. Until then, we do not expect the ECB to seriously discuss changing its current key rate of 2.0%. In the UK, inflationary pressures took also a downwards step with the growth and employment outlook appearing fragile, which allows the Bank of England likely to cut its policy rate further. In Switzerland, inflation is likely to remain at the lower end of the SNB's target range of 0% to 2%, but the SNB's Governing Board has made it clear that the hurdle for a move ‘below zero’ remains high. We currently expect the SNB to neither cut nor raise interest rates and expect the key rate to remain at 0% well into 2026. China saw a significant jump from 0.2% to 0.7% in November but still seems to wrestle more with too little inflation. Over the medium term, however, we expect the government’s anti-involution campaign to reduce some overcapacities in the economy and to lead to a higher inflation level. On a global scale, we identify a slow but important shift away from the “cutting cycle” dogma by central banks outside of the US and the UK and expect to see more voices, raising the idea of keeping rates steady or thinking about raising interest rates at some point in 2026.
Pillar 2: Liquidity (POSITIVE)
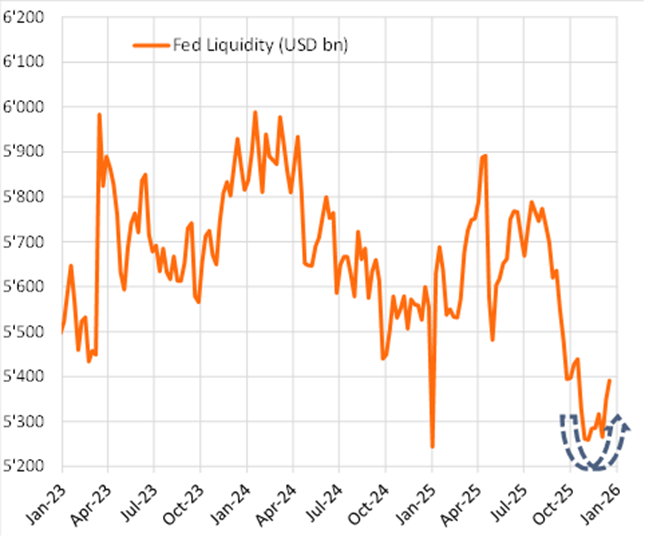
Overall liquidity conditions remain again positive for financial markets during the last month. Support came from the US as the central bank balance sheet of the US Fed increased again. The Fed finally halted quantitative tightening (QT) of its balance sheet at the start of December and announced at its last meeting that it would begin expanding the balance sheet again in order to provide ample liquidity to the US financial system. As shown by the improved liquidity measures below, this shift—together with the ongoing global rate-cut cycle, in which the Fed and the Bank of England cut rates again in December while only the Bank of Japan began to raise rates—and broader global liquidity injections continue to support global liquidity conditions and make liquidity a positive factor for real assets. However, it is important to bear in mind that the global easing cycle may come to an end sooner rather than later, as the BoJ has already increased its policy rate and other central banks, such as the Bank of Canada and the Reserve Bank of Australia, have begun to discuss the possibility of rate hikes in 2026 more seriously.
Chart 1: Our liquidity indicator (global M2 measure) did surge further over the last weeks
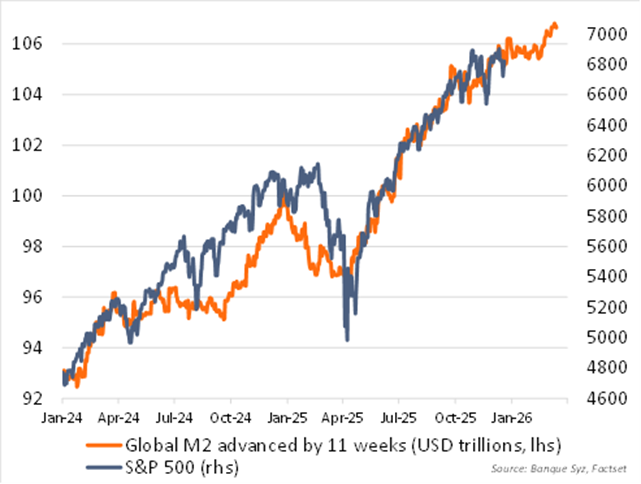
At the time of writing, our Global M2 proxy still points to a broadly supportive liquidity environment for risky assets through the end of 2025. It suggests a supportive liquidity environment and momentum for the first weeks of 2026.
Chart 2: The Fed’s balance sheet is now expanding again
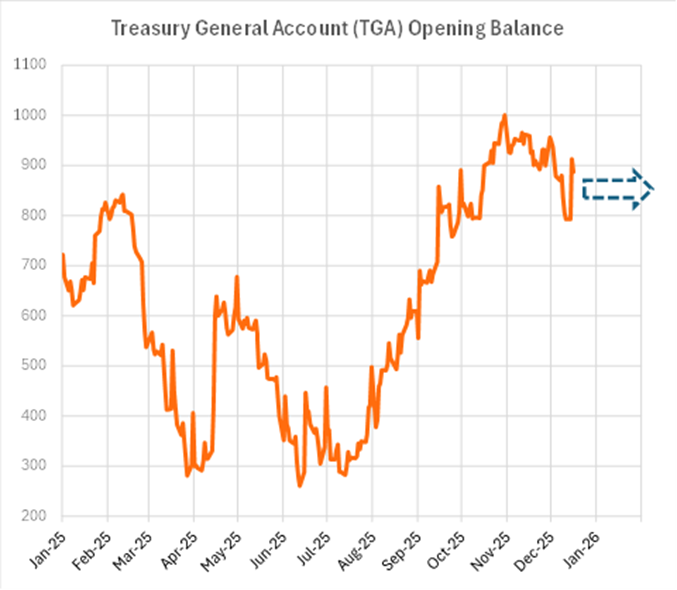
An important indicator we have been watching over the last months was the US Treasury General Account (TGA), which is basically the US government’s bank account at the Fed. When more money is sitting in the TGA, this means less liquidity flowing to the financial markets. As the government reopened after the end of the shutdown in November, the liquidity coming from the expenses of the government was a positive factor for the overall liquidity in financial markets. We saw this indicator to signal more liquidity coming during the last weeks and expect now a sideways trend over the weeks to come–after having been a tailwind in the first half of the year and during the latest US government shutdown.
Chart 3: The US government’s “bank account” at the central bank is expected to stay “neutral” for liquidity in the weeks to come
Overall, the announced expansion of the Fed’s balance sheet in combination with further liquidity likely coming from China’s PBoC we expect the liquidity indicator to stay positive for risky assets at the start of 2026. To us, the relationship between risk assets and our Global M2 proxy remains a useful gauge of one of the important drivers of equity markets, but its impact could be offset by other macro or market factors from time to time.
Pillar 3: Earnings (POSITIVE)
The global earnings outlook for 2026 remains constructive, supporting equities despite elevated valuations. The United States is expected to maintain its position as the world’s “compounding region,” with earnings growth accelerating in 2026. This improvement should be driven by industrials, materials, and energy, alongside continued strength in technology and AI-related sectors.
Europe is likely to enter a cyclical recovery after flat earnings in 2025. The drag from tariffs and currency volatility is expected to ease, while German stimulus should begin to support growth from the second quarter of 2026. Although earnings estimate in Europe were revised lower earlier due to tariffs and a stronger euro, revisions have recently stabilised.
Emerging markets are set to benefit from sustained AI-driven semiconductor demand, particularly in Korea and Taiwan, a more dovish Federal Reserve, and improving conditions in China. Chinese equities have already begun to recover, led by technology, while broader economic activity should improve gradually as stimulus offsets measures aimed at reducing industrial overcapacity. AI-related investment is expected to remain strong as China pushes for greater self-sufficiency.
Japan’s earnings growth should remain steady, supported by AI demand and government stimulus, though yen volatility remains a key uncertainty.
Overall, recent earnings results have exceeded expectations, especially in technology, and companies have largely preserved profitability despite tariffs. Earnings revisions remain strongest in technology and AI, helping U.S. earnings expectations for 2026 outperform other regions. Among the “Magnificent 7”, earnings growth is expected to slow from 28% in 2025 to 17% in 2026 but remain above the broader market, while S&P 500 earnings growth is forecast to accelerate modestly to 13.5%.
Pillar 4: Valuations (NEUTRAL)
Equity market valuations are elevated, largely due to high multiples for US large-cap stocks. However, these valuations are supported by strong growth and profitability.
As global activity improves, other regions with lower valuations offer catch-up potential. We do not expect non-US or non-technology multiples to reach US tech levels, but some convergence is likely.
Concerns about an AI bubble persist, with parallels drawn to the dot-com era. However, unlike 2000, current performance is earnings driven. For instance, Nvidia now trades at a lower PE multiple than Costco or Walmart, which are GDP-like growth companies.
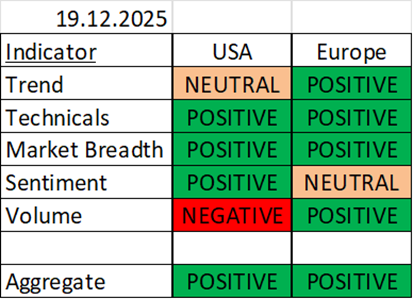
Pillar 5: Market dynamics (POSITIVE)
The US raw score decreased from 91% to 82%, as volume indicator turned negative.
No change in European indicators, with 8 out of 10 are positive. Only the RSI (one of the three technicals indicator) and the put-call ratio are negative.
As a result, the total equity allocation remained at 100%, split equally between the US and Europe.
With 4 pillars (macro, liquidity, earnings and market factors) signalling an overweight and 1 in neutral (valuations), the weight of evidence is positive for equities.
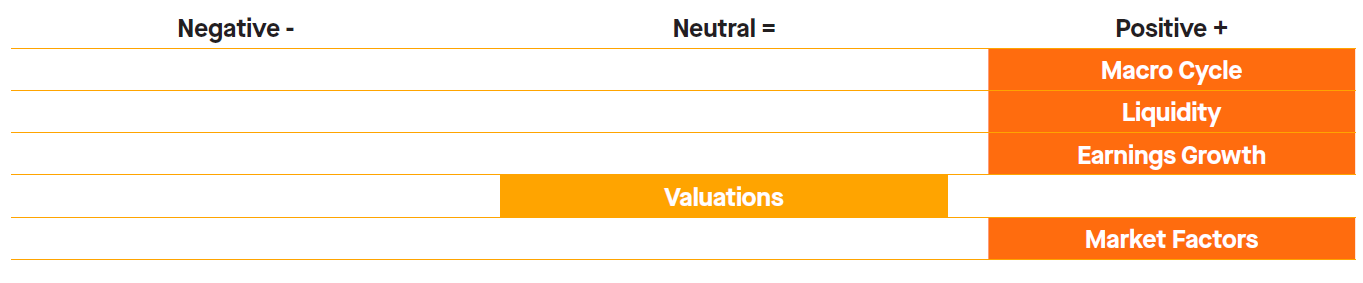
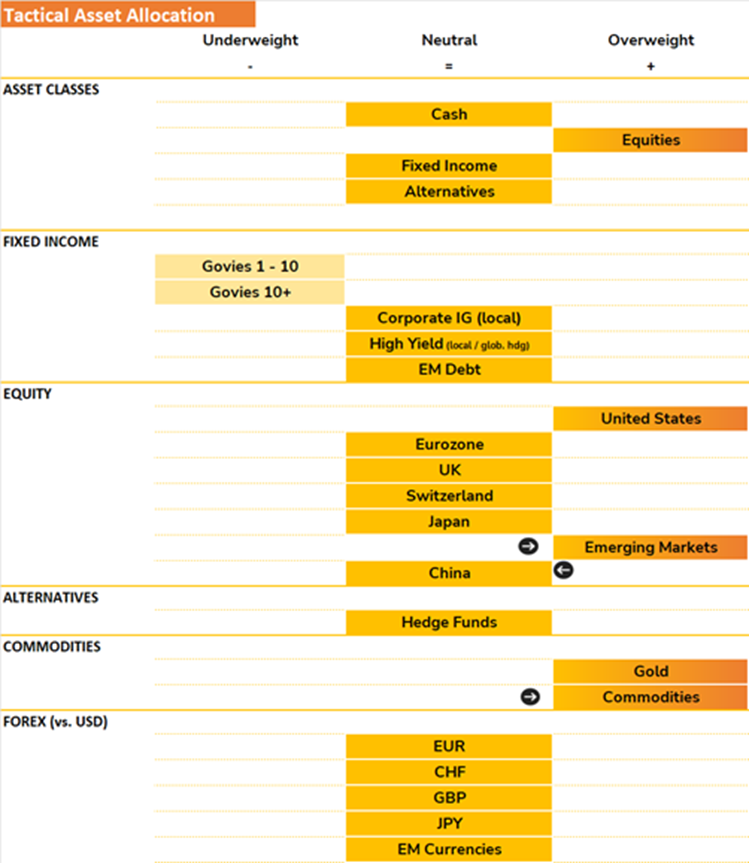
(Arrows show our latest TAA moves).