

.png)
The US mid-term elections seem to have delivered their verdict. The anticipated Republican red wave did not happen. Congress passed (narrowly) into Republican hands while the Democrats were able to retain a majority in the Senate. The US is therefore heading towards a divided government that could lead to a number of budgetary decisions being blocked and - potentially - to a new debt ceiling episode.
However, the markets seem to be unconcerned about this event. Perhaps this is because investors are focused on the historical data showing that we are in the best phase of the presidential cycle.
What is the presidential cycle?
As a reminder, the term of office of an American president lasts four years. Yale Hirsch, a stock market historian, has developed a theory that this four-year cycle has a predictable effect on the economy and stock market performance.
According to Hirsch, the US stock market declines in the first and second year of an election term. This is because when a president is elected, he or she must strive to deliver on campaign promises. This may include reforms that have a negative effect on the market.
In the third and fourth year of his presidency (i.e. after the mid-term elections), the incumbent president starts campaigning again. Having a strong economy is a great way to get votes. Therefore, the president is likely to prioritise programmes that aim to boost the economy. If these programmes are successful, this can logically have a positive effect on the stock market.
For example, the years following Richard Nixon's election in 1968 fit the presidential cycle theory. The Dow Jones Industrial Average fell by 15.2% in 1969, then rose by 4.8%, 6.1% and 14.6% in 1970, 1971 and 1972, respectively. Some have attributed the gradual improvement in stock performance over the four-year cycle to the fact that Nixon boosted the economy to increase his chances of re-election.
Statistics since 1932
Goldman Sachs has conducted a study of the S&P 500's performance (excluding dividends) over periods from November to November for each year of each presidential cycle since 1932.
As the chart below shows, on average the S&P 500 performs less well in the first and second years of a president's term. And it is in the mid-term year (i.e. 2022 in the current cycle) that the average performance is by far the worst (1%).
Over the last 90 years, the best performance is observed in the 3rd year, i.e. the one to come (if history were to repeat itself). Not only is the average performance much better than the other years (17%), but the third year was positive in 95% of the cases. Goldman Sachs also points out that performance has been higher under divided governments.
Performance of the S&P 500 (excluding dividends) for each year of the presidential cycle
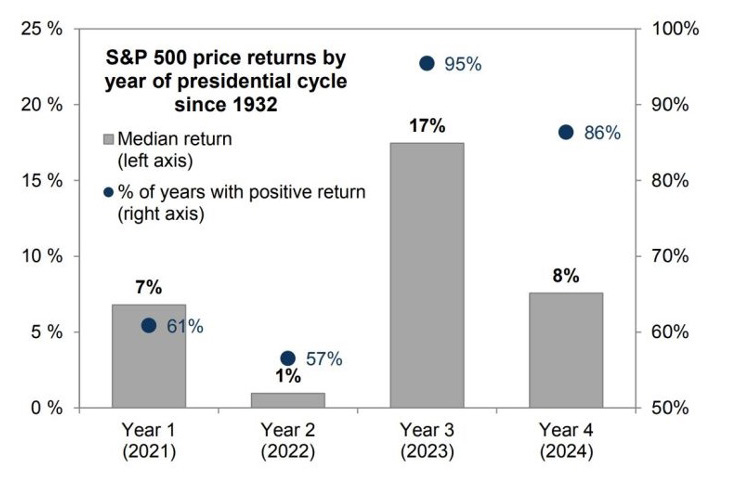
Source: Goldman Sachs
Not an entirely reliable indicator
A closer look at the numbers shows that this theory held true for most of the 20th century, prompting many investors to use the presidential cycle as an indicator of market timing for the stock market. However, it has since lost its predictive power. In the 21st century, the stock market did very well in the first year of the Biden, Trump, Bush and Obama administrations. However, the second year of the Biden administration is indeed very complicated from a stock market point of view.
Therefore, investors are advised against using the presidential cycle as a stand-alone indicator. It is essential to take into account other factors that may influence economic and market conditions, as there are systematic and idiosyncratic risks that go far beyond a presidential election.
Furthermore, the US President does not have the power to control what happens in the global political environment, although the actions of the President or Congress can affect financial markets via the effects on the dollar or the importance of the US market in the World Equity Index (almost two thirds of the MSCI World capitalisation).
Conclusion
Investors can use the 4-year presidential cycle theory as one indicator among others to try to predict US equity market performance.
However, they should keep in mind that this theory does not always accurately explain stock market performance. Over the last 10 four-year presidential election cycles, the presidential election cycle theory has held true only half the time.