.png)
Most major asset classes produced positive returns over the quarter. Optimism around AI, easing trade tensions, and expectations for US interest rate cuts supported markets. Growth stocks outperformed value stocks (+8.6% vs +6.0%). Emerging markets were strong, up ~11.0%, led by Chinese equities. Among regional markets, Asia ex-Japan was the top performer (+11.1% in $ terms). China tech names had a very strong run (e.g. Hang Seng Tech +22.1%). US equities (S&P 500) gained 8.1%. Europe ex-UK lagged, with weaker performance especially in Germany.
Global bonds ended modestly positive (+0.6%) despite volatility. US government bonds gained roughly 1.5% while European sovereign bonds were slightly negative, in part due to political/fiscal pressures (e.g. France). Japanese government bonds (JGBs) were weak, falling 1.5%. In credit markets, Emerging Market debt did well, benefiting from tighter spreads. High-yield and investment-grade credit saw spread tightening and modest positive returns.
The broad Bloomberg Commodity Index ended up 3.7% for the third quarter. Expectations of a surplus in the oil market weighed against elevated geopolitical tensions leaving oil prices down 0.8%, while gold rallied.
As we head towards the last quarter of the year, we remain in a K-shaped economy, especially in the US with a 2-speed economy. On one hand, the GenAI / Technology sector has a strong contribution to US economic growth while upper income consumers are still doing well. On the other hand, medium-lower income consumers, the manufacturing sectors and interest-rate sensitive sectors are all struggling. Will deregulation, fiscal & monetary stimulus help to make growth more balanced? Or will it end boosting even more the upper part of the K?
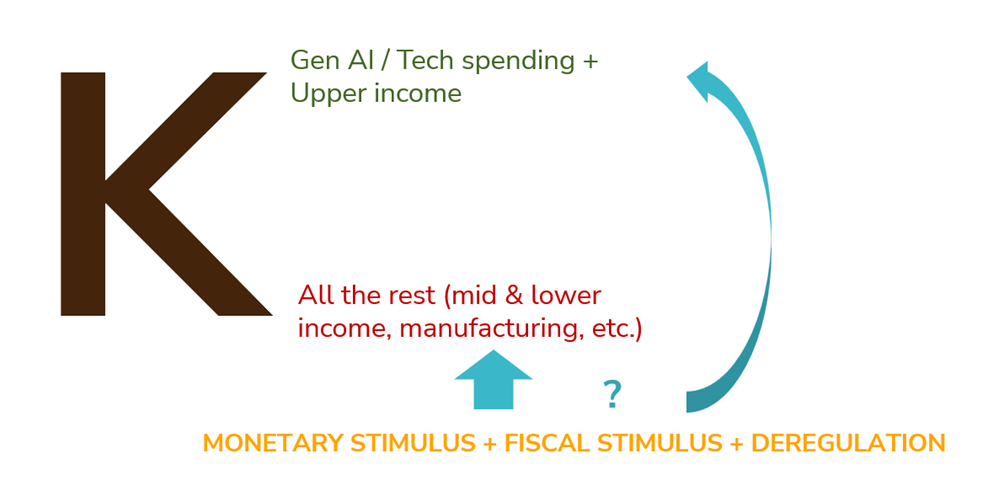
These are among the key questions investors are facing for Q4 and beyond. Other downside risks include geopolitical tensions in the Middle East, escalation of Russia/Ukraine conflicts, sticky inflation in the US, rising bond yields in Japan and looming sovereign debt crisis (e.g France, UK, etc.).
With valuations for large-caps being stretched, many asset allocators wonder if the bull market can extend in the 4th quarter? Over the last 76 years, when the S&P 500 climbed in the first nine months of the year, investors saw gains in the fourth quarter almost 90% of the time.
History doesn’t repeat but often rhymes… Still, let’s have a look at our macro, fundamentals and technical indicators.
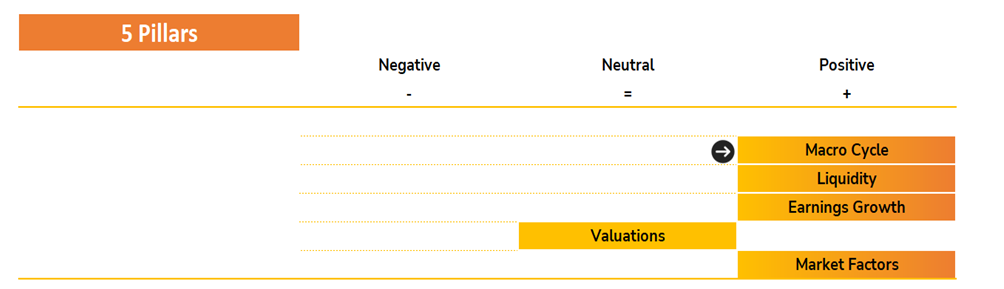
Our asset allocation preferences are based on 5 indicators, including 4 macro and fundamental indicators (leading) and 1 market dynamics (coincident). The weight of the evidence suggests a constructive view on equities (positive). Below we review the main drivers for each of them.
Pillar 1: Macro cycle
(from NEUTRAL to POSITIVE)
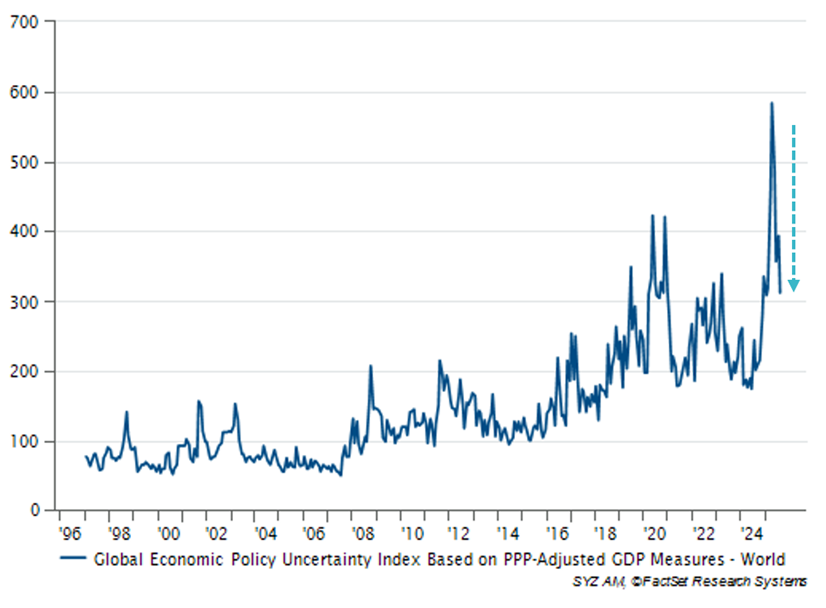
The latest global economic activity data suggests that the world economy did stabilise on low levels (below historical average) and shows early signs of a recovery. We expect global growth to gradually move toward a modest recovery as trade uncertainties ease, following the implementation and clarification of new US import tariffs.This outlook assumes no additional shocks, as uncertainty around tariffs — particularly with no decision yet on semiconductor duties — as well as ongoing geopolitical and fiscal risks, remains elevated.
Chart 1: Global uncertainty around the new US trade tariffs decreased substantially
In the United States, economic data showed a solid growth picture and surprised to the upside last month. Current leading indicators point to an ongoing robust economic activity. Additional fiscal support should help to impede a drop in household demand and to balance out the weakening of the labour market. Also, the new US-immigration policy seems to have shifted the supply of work substantially, keeping the labour market in balance even with the low demand for work by companies. This is currently overshadowed by the US government shutdown. However, we expect the political stalemate to be resolved in October and not to derail the solid growth path of the economy – although there is a risk of seeing a more negative impact on the US economy. Several other downside risks prevail, such as delayed tariff impacts on prices and demand, energy prices and the debt burden for households and the government.
In the Eurozone, US tariffs, the euro strength, and still elevated energy prices will dampen the economic recovery, but leading indicators such as business sentiment and outlook surveys, point to an improvement of conditions. Consumer confidence, which remains weak, started to improve last month as well as the mood in the industry and service sector. The ongoing war in Ukraine and the political turmoil in France still pose a risk to the nascent recovery. Fiscal stimulus should help to spur growth towards the end of the year and in 2026.
In Switzerland, the substantial new tariffs on exports to the U.S., imposed on August 7, weighs on the outlook. Nevertheless, the Swiss economy has so far shown considerable resilience. The recent U.S. tariff announcement on pharmaceutical goods appears, in the current assessment, to have only a limited negative impact. However, if the 39% on parts of the Swiss exports to the US persist, a temporary growth contraction becomes likely for 1 or 2 quarters, also exacerbated by the strong Swiss Franc. However, after a potential new trade deal between the US and Switzerland, we would expect a swift stabilisation and a modest recovery to take place in Switzerland, supported by low rates, and fading global trade uncertainties.
In China, we expect most of the negative tariff impact to be balanced out by additional fiscal support, which should help to keep growth on a solid level. Yet, consumer sentiment will likely remain weak due to overcapacity and real estate imbalances, while business sentiment looks set to rise. The government’s new “anti-involution” campaign against overcapacities poses a risk to domestic growth but this should be alleviated by a potential additional fiscal stimulus in Q4. The ongoing uncertainty about a final trade deal between the US and China remains a risk factor to growth, but China’s export sector seems to have found enough trading partners willing to do more trade with China and balancing out the drop in exports to the US.
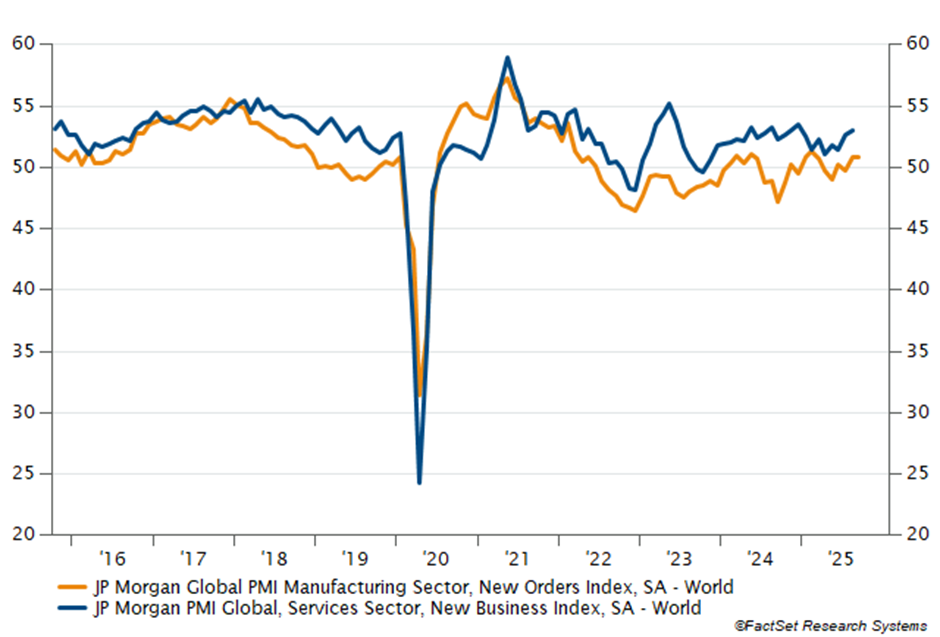
Chart 2: Global leading indicators point to a rebound in services and manufacturing sector new orders - a positive signal for the global outlook
Recent US inflation data confirmed that the pass-through of tariffs has been slower and milder than expected, but also highlighted ongoing underlying pressures in the domestic services sector. This seems to worry the USFederal Reserve for the months to come, as several speakers hinted at this problem in their latest appearances. The stop-and-go pattern of orders around tariff deadlines creates a noisy goods inflation picture. Some clarity on final tariff levels helps to improve visibility on the outlook, while most firms still say that the passing of a higher share of tariff costs to consumers, is still in the making. The current US government shutdown will blur the picture of the job market and inflation, as no official data will be published in this period. In the UK, inflationary pressures remain persistent and a headache for the Bank of England, whereas in the Eurozone, we maintain our relaxed inflation outlook. Swiss inflation will likely stay in the lower range of the SNB’s 0% to 2% inflation target band while China wrestles with a deflationary picture, mirroring the overcapacities in the industry and the weak domestic consumer sentiment.
Pillar 2: Liquidity (POSITIVE)
In continental Europe, the ECB stopped its cutting cycle and we expect the central bank to stay at this level well into 2026 – baring any new negative shocks.. The Swiss National Bank (SNB) also kept its policy rate at zero, and we expect it to remain unchanged in the coming quarters, provided there is no significant appreciation pressure on the Swiss franc or severe negative impact on growth from the US tariffs. In addition, the SNB board said to try to avoid a negative policy rate, because it sees more negative than positive effects of rates below “zero”. Also, the new agreement with the US administration seems to give more leeway to the SNB to engage in FX interventions and not to be fully reliant on interest rate cuts. In Europe, the Bank of England is the only major central bank that still keeps its policy rate in restrictive territory.
Across the Atlantic, the Federal Reserve is the other major central bank, that arguably has a restrictive monetary policy in place. The Fed conducted its first rate cut this year in its September meeting. Markets expect a continuation of the cutting cycle with about 4 rate cuts until summer 2026. Apart from the current pressure by the US government to lower rates, we still see upside risks to the US inflation which would constrain the Fed’s room for manoeuvre – as long as the US labour market does not weaken and economic activity stays robust, which the latest data seems to confirm. The situation is similar with the BoE, which also has scope for interest rate cuts, but faces the dilemma of promoting economic activity after weak growth on the one hand and curbing the continuing upward pressure on prices on the other.
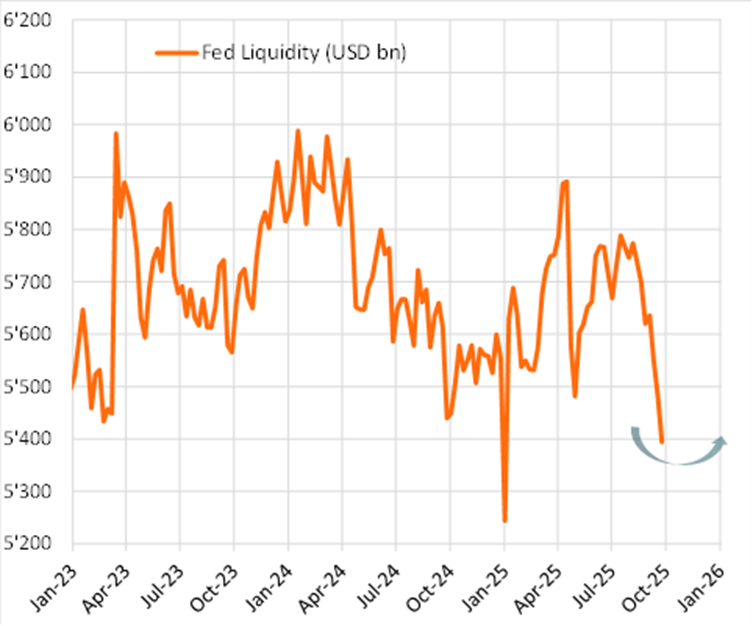
The ongoing “normalisation” of global monetary policy was again reflected in our global liquidity proxy, which continued to point to a supportive liquidity environment for risk assets. However, the “liquidity tailwind” is losing steam. The forward looking indicator started to move downwards, indicating receding additional tailwind to liquidity. Provided the relationship continues to hold, the support for risk assets will decline in the coming months, but is on average still positive. The weak US dollar was decisive for the evolution of our global M2 proxy and our current view of a stabilisation of the US dollar will limit the positive future development of our indicator. Fed liquidity is no longer a temporary headwind, as the US Treasury’s General Account at the Federal Reserve appears replenished, and the backlog in issuing Treasury bills has eased. This was necessary after the “plundering” of the “Federal checking account” since the beginning of the year. Although these conditions are expected to become less supportive than they were during summer, overall liquidity conditions continue to be favourable for risk assets .
Chart 3: Global M2 versus S&P 500 lagged 11 weeks
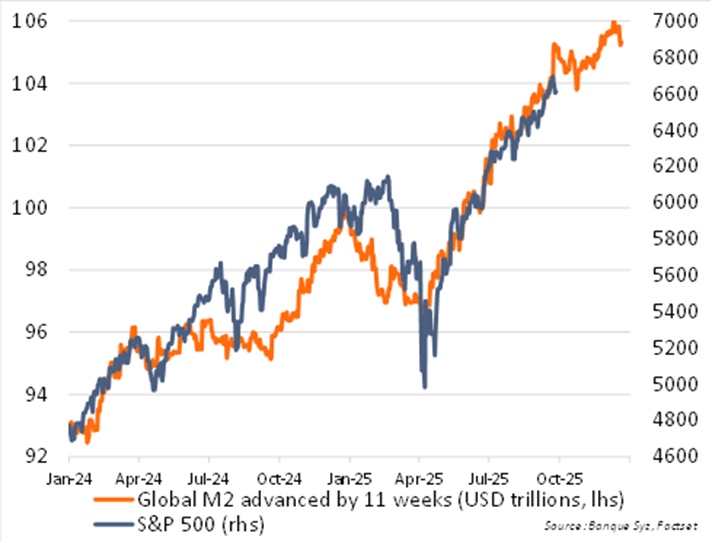
Chart 4: Liquidity indicator for the US Federal Reserve
Pillar 3: Earnings (POSITIVE)
Earnings growth remains a key tailwind for risky assets, particularly equities. However, the third-quarter reporting season is expected to represent a soft patch. The second quarter, initially projected to be weak, turned out surprisingly strong as the implementation of US tariffs was delayed and companies rushed to build inventories ahead of the new trade measures. Moving into the third quarter, the impact of these tariffs will start to be felt, and earnings are therefore expected to soften sequentially (i.e., Q3 vs. Q2). Weaker growth is particularly anticipated among US small caps—given their limited bargaining power relative to larger peers—and in Europe, where tariffs have already gone into effect. Looking ahead, earnings growth is expected to reaccelerate in the fourth quarter as the tariff shock is progressively absorbed. Equity markets are already looking beyond this soft patch.
Looking into 2026, earnings growth is expected to accelerate and broaden compared with 2025.
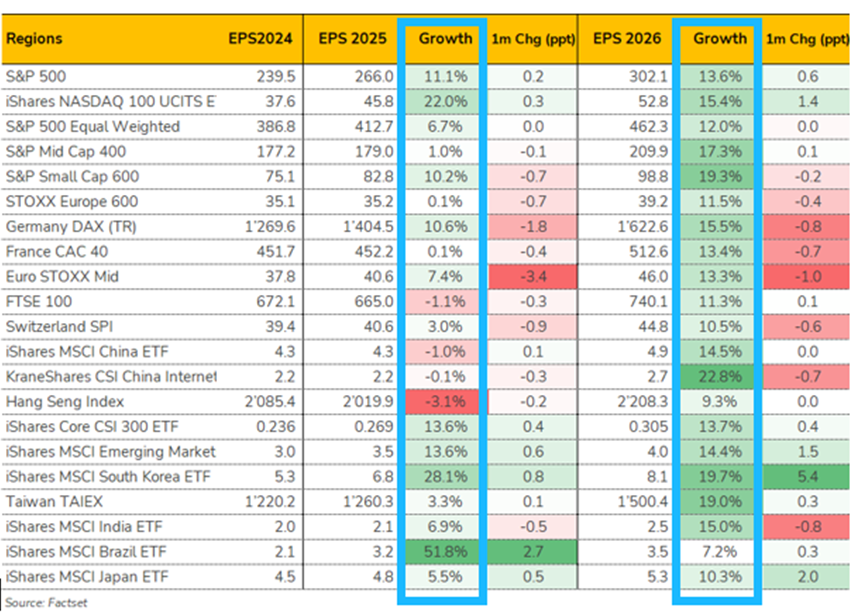
In the United States, earnings growth for the S&P 500 is forecast to rise from +11% in 2025 to +13% in 2026. While growth in recent years has been driven almost exclusively by technology, 2026 should see a more balanced contribution. Technology earnings are expected to remain strong, while “old economy” cyclical sectors—such as Industrials, Materials, and Consumer Discretionary—are likely to experience a recovery. Small-cap companies, which have struggled under weak growth and high interest rates, are also projected to see an earnings rebound. Despite expectations of strong cyclical earnings growth, revisions remain negative, whereas Technology is the only sector showing consistent positive revisions.
In Europe, earnings are expected to be flat in 2025 as economic weakness, foreign-exchange headwinds, and US tariffs weigh on corporate results. In 2026, however, a cyclical rebound should take hold. European earnings are forecast to grow +11%, led by cyclicals and the automobile industry, which is expected to bottom in 2025. That said, revision trends remain negative, particularly in Energy and Autos.
In China, MSCI China earnings are set to contract in 2025, reflecting ongoing macro challenges. A recovery is expected in 2026, with earnings growth of +14%, led by technology. AI-related investments, which have lagged those in the US, are now accelerating sharply, fuelling broader technology demand. This investment cycle is also benefiting other emerging markets with a tech bias, notably Taiwan and South Korea, home to giants like Samsung Electronics and TSMC.
In Japan, earnings growth is expected to accelerate to +10% in 2026, supported by a favourable macro backdrop and higher domestic inflation.
In summary, overall, earnings remain a supportive driver for equities and help justify elevated valuations. More linear inflationary pressures across the globe—from the US to Japan—are boosting nominal growth (real growth plus inflation), which in turn drives corporate earnings. This dynamic highlights why equities can serve as a hedge in periods of monetary debasement.
Earnings growth is expected to accelerate and to broaden in 2026 vs. 2025 thanks to continuous strength in technology and cyclical pick-up elsewhere: :
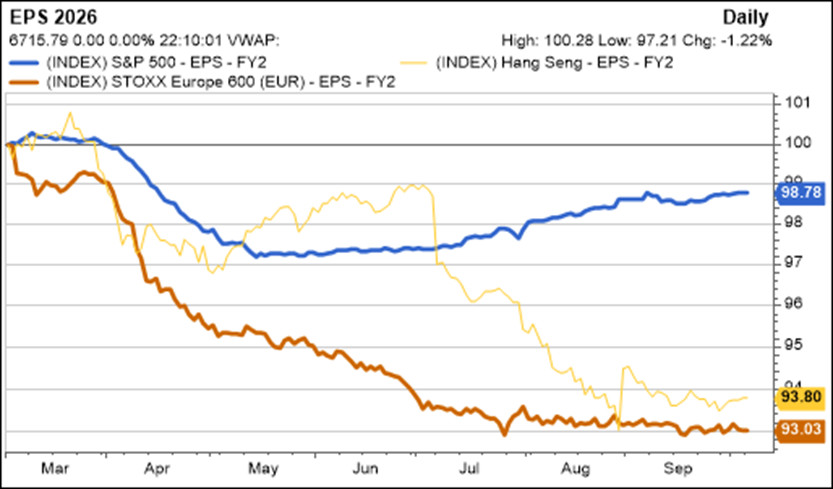
Earnings revisions for 2026 are stabilising globally with US revisions flat to positive and negative revision in Europe and China stabilising:
Pillar 4: Valuations (NEUTRAL)
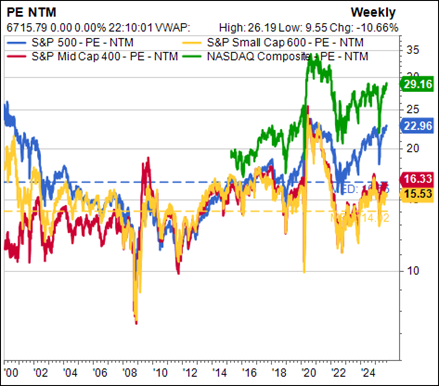
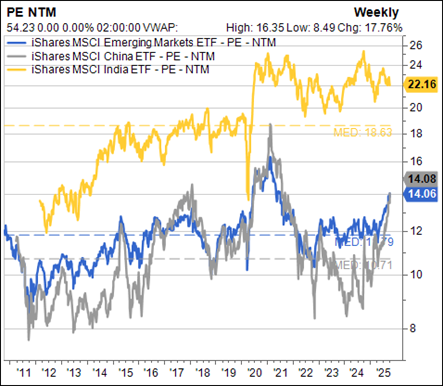
Equity valuations for large US companies remain elevated, although the growth and profitability of these mega-cap stocks are difficult to compare with historical standards. International equities are more reasonably priced relative to their history, but they do not benefit as much as the US market from the AI tailwind. Within major markets, China has re-rated from less than 9x forward P/E in 2023/24 to around 14x currently, as investors once again consider China “investable” and the AI narrative gains traction. Finally, it is worth noting that a decline in the value of money, or monetary debasement, tends to support equities as an asset class.
US technology-heavy indices (left chart) such as the Nasdaq (green) appear expensive today, while Chinese equities (right chart), having re-rated significantly, are no longer cheap:
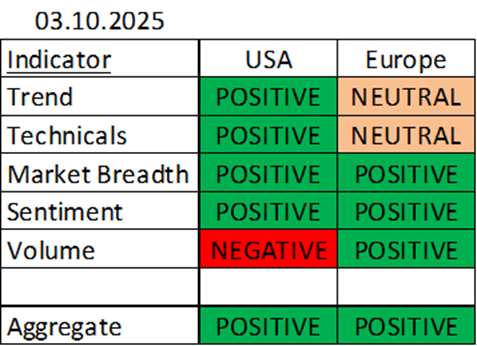
Pillar 5: Market dynamics (POSITIVE)
Our US market indicators remained stable, with the raw score holding steady at 82%.
In Europe, market breadth recently turned positive, supported by upgrades in both the participation and high-low indicators. Volume also turned green. As a result, the European raw score rose significantly from 45% to 75%.
The portfolio allocation of our Symphony strategy, based on these indictors, remains fully invested in equities (100%), but 25% has been rebalanced toward European equities.
With 3 pillars (liquidity, earnings and market factors) signalling an overweight and 2 in neutral (macro, earnings and valuations), the weight of evidence is positive for equities.
EQUITY
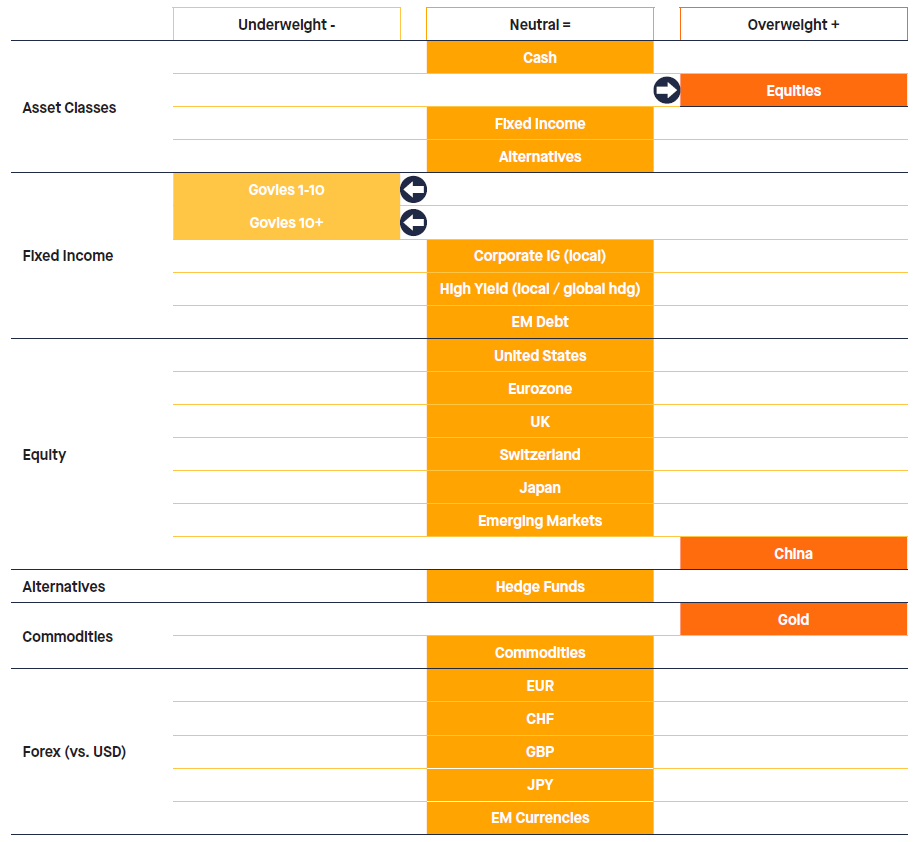
Positive market effects have pushed our global equity exposure to overweight. The positive assessment of 4 Pillars (out of 5) incites us to not do any rebalancing. We thus keep the equity stance to OVERWEIGHT.
We haven’t implemented any changs to our regional preferences: China remains overweight and all other regions stay at Neutral. This implies that the overweight stance on global equities is played evenly across the regions – with the exception of China.
Despite demanding valuations, US equities continue to benefit from multiple tailwinds (monetary policy, fiscal policy, deregulation, Gen AI secular trend, earnings growth momentum, etc.). From a sentiment and positioning perspective, we have not observed widespread “irrational exuberance” at this stage. Many asset managers and hedge funds missed the V-shaped recovery that began in April and may now need to adjust their exposures.We are seeing early signs of style / size / sector broadening but large-caps continue to outperform.
International equities continue to trade at a discount relative to US equities but there are reasons for this – as mentioned in the “earnings growth pillar” section. We continue to seek international equity exposure within portfolios and thus keep our current exposure in Europe, Japan and Emerging Markets. China is exhibiting strong momentum and continue to benefit from several tailwinds (double-digit earnings growth, fiscal & monetary policy support, etc.) – hence our overweight stance.
FIXED INCOME
The overweight stance in equities is funded by an UNDERWEIGHT in Fixed Income. We have reduced the exposure to Government bonds 1y-10y and 10y+ to underweight. Our stance on Investment Grade corporate bonds, high yield bonds and Emerging Markets debt remains unchanged. Spreads are tight across credit but we don’t see any reason to turn negative at this stage.
In Swiss Franc reference currency profiles, we keep Government bonds 1-10 as underweight. High Yield, EM debt and Investment Grade Corporate have been upgraded to Overweight
FOREX
We keep the neutral stance on the USD against all currencies. Our reasoning is the following:
- The Fed might be less dovish than the market anticipates
- Fiscal and political issues in Europe could create headwind for the euro (and thus boost the demand for the greenback)
- From a technical perspective, it seems that the dollar is bottoming out as no new lows have been observed despite a negative news flow (fear of Fed losing independence, inflation data, etc.)
ALTERNATIVES
Within alternatives / commodities, we keep our gold and hedge fund exposure for diversification purposes.
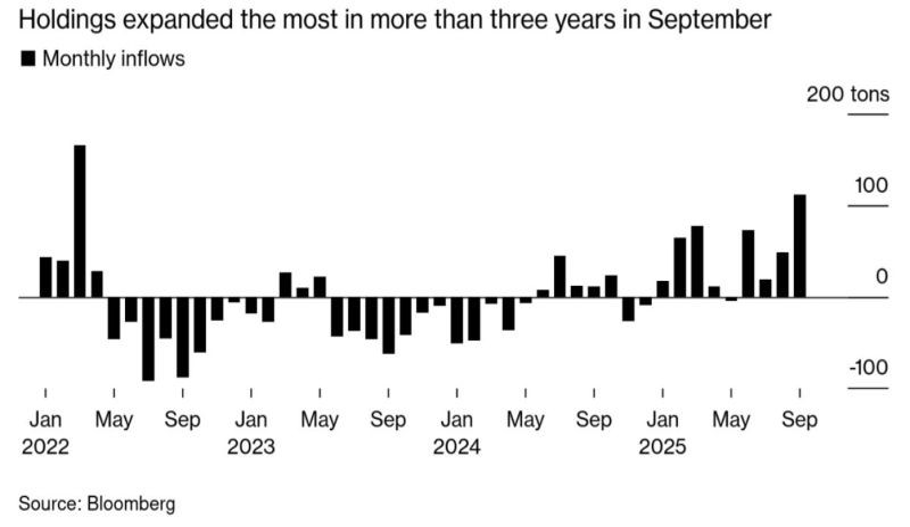
Gold trades at a new all-time high as investors seek protection from monetary debasement, a trend which is probably the most obvious we can see. Investors’ appetite for gold surged in September, with ETFs recording their largest inflows since early 2022.
TACTICAL ASSET ALLOCATION (TAA) – October 2025