

.png)
Chart #1 —
A positive divergence
Major US stock indices posted gains last week, with the S&P 500 ending above the 4,000 level for the first time in two months. Favourable earnings reports in the retail and technology sectors, as well as indications that the Fed is open to slowing the pace of its rate hikes, helped fuel the stock market rally. Trading was light as the Thanksgiving holiday approached.
In terms of technical analysis, one indicator points to what is called positive divergence. The percentage of S&P 500 stocks trading above their 200-day moving average (64%) is now above the August figure, while the S&P 500 has yet to reach the highs seen during the summer rally. Market depth is a leading indicator and this divergence could mean that the S&P 500 still has some upside potential in the near term.
S&P 500 ETF (blue) vs. % of stocks above their 200-day moving average (orange)
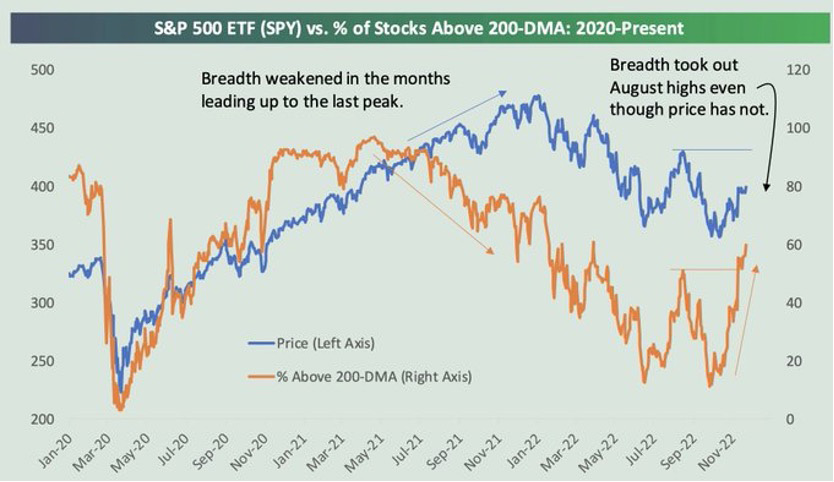
Source: Bespoke
Chart #2 —
Selling pressure by S&P 500 corporate insiders at extreme low
Another positive signal for equity markets is that the number of company executives selling their company's shares is currently at a very low level, indicating confidence in their company's share price potential. Historically, this type of indicator has worked quite well to signal market reversals.
S&P 500 Index (black) versus insider selling pressure (blue)
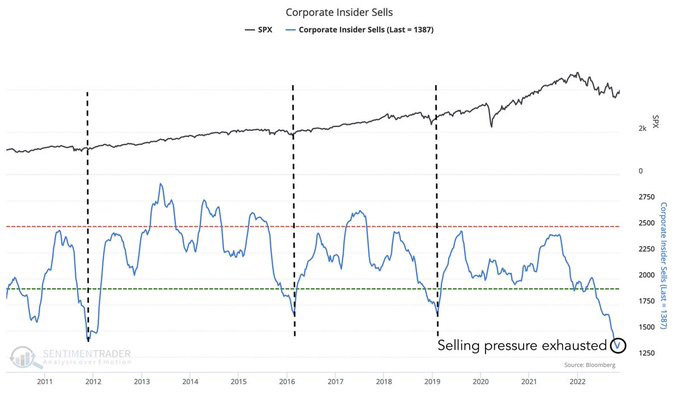
Source: Sentimentrader
Chart #3 —
The pace of Fed rate hikes should slow down
The minutes of the Fed meeting indicate that a "substantial majority of participants" felt that a slower pace of interest rate increases would be appropriate. The economic figures released last week were rather mixed, but signs of a weakening economy support market hopes that the Fed would soon be able to slow down the pace of monetary tightening.
U.S. Treasury bond futures still suggest some rate hikes, followed by rate cuts
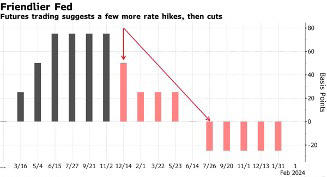
Source: Bloomberg
Chart #4 —
The inversion of bond yield curves is becoming more pronounced
In the United States, yields on long-term Treasury securities have fallen more than those on short-term securities, resulting in a further inversion of the bond curve. Ten-year Treasuries now yield about 77 basis points less than the two-year maturity, the largest inversion since 1980.
The curve is also inverted in Germany. This is the largest inversion in 30 years. This indicator has mostly preceded economic recessions in Europe.
2-year and 10-year bond yields spread in Germany
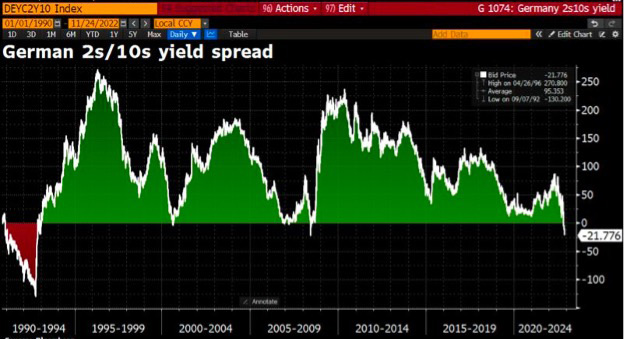
Source: Bloomberg
Chart #5 —
US tech majors not participating in S&P 500 rebound
Technology mega-caps (including the FAANGs) are no longer among the leaders of the US stock market. On the contrary, they are currently diverging from the performance of the S&P 500 and missing out on the rebound.
Technology Mega-Cap Index (red) vs. S&P 500 Index (white)
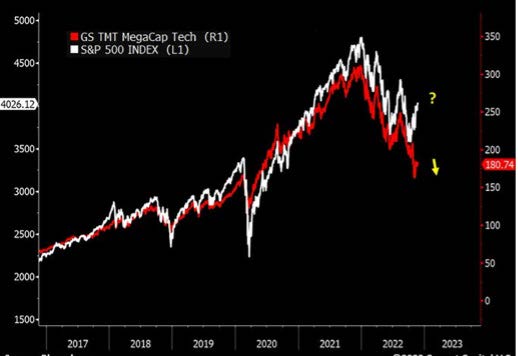
Source: Bloomberg, Crescat Capital
Chart #6 —
A rebalancing of sector weights in the S&P 500 Index
Another visual representation of the change in leadership described above is the evolution of the weight of certain sectors in the S&P 500 index. During the QE years, the weight of the healthcare and technology sectors in the index increased dramatically, reaching 44% at the peak. Their cumulative weight has already started to fall, as they now represent "only" 40%. In contrast, energy and financials reached a low of 15% (cumulative) in 2020. Their weight
is now 21%. Yesterday's winners will not necessarily be tomorrow's winners...
Secular rotation from Healthcare/Tech to Energy/Financials
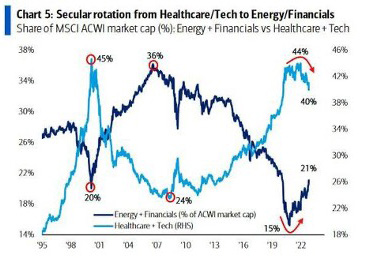
Source: BofA, Datastream
Chart #7 —
The relative valuation of US equities compared to the rest of the world reaches a new high
International investments were not spared the bear market in 2022. In fact, international stock markets underperformed the US stock market, an underperformance exacerbated by a strong dollar. The overvaluation of the US market has reached a new high. This extreme level is reflected in the weights of the various countries in the MSCI World Index, with the US now accounting for 70% of the index...
Valuation of US equities relative to international equities
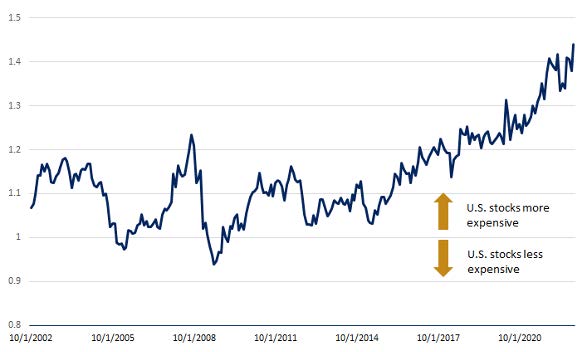
Source: Edward Jones