

.png)
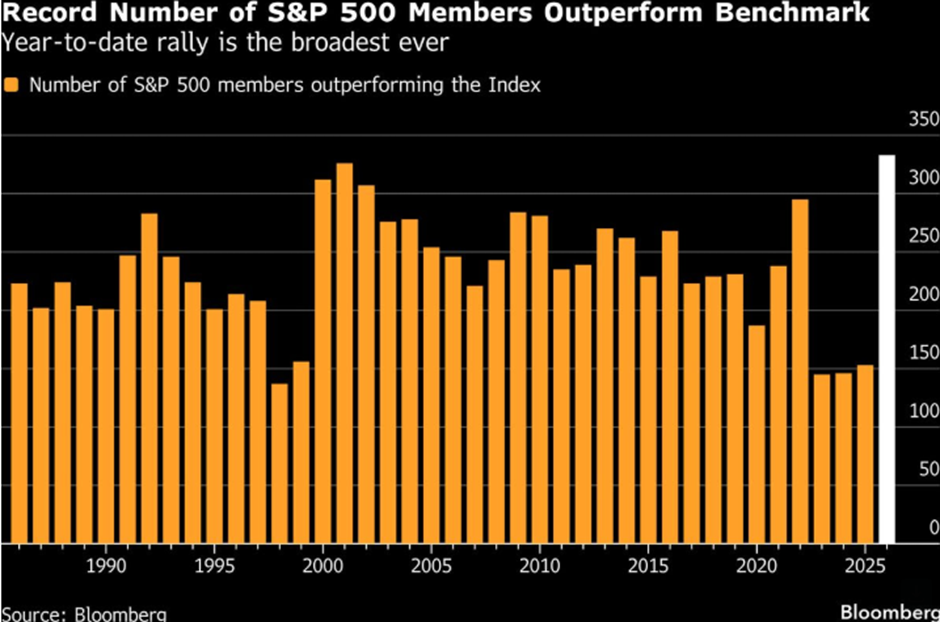
Source: Bloomberg
Chart #2 —
The stock removed from the Dow outperformed its replacement
On 31 August 2020, Exxon Mobil was removed from the Dow Jones Industrial Average and replaced by Salesforce. Since that reconstitution, Exxon has gained 271%, whereas Salesforce has fallen 32%.
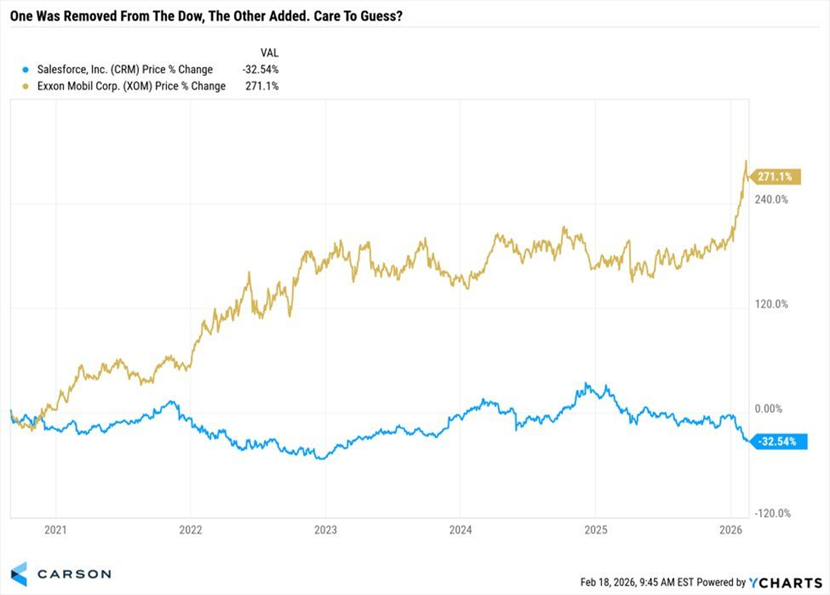
Source: Ryan Detrick
Chart #3 —
Software stocks didn’t just pull back – they were repriced
The idea that “SaaS is dead” has gained traction, but the reality is more complex. The companies in question are often best-of-breed platforms with recurring revenues, loyal customer bases, and solid balance sheets. The pressure is not about survival, but about durability in a shifting competitive landscape.
Artificial intelligence has altered the economics of software development. When a single developer can deploy tools in minutes, automate workflows through prompts, and bypass traditional engineering cycles, elements of the traditional SaaS model begin to look exposed. The market is now questioning pricing power, seat-based scalability, and’ most of all, defensibility. If development time keeps heading towards zero, narrow point solutions will be the first to face scrutiny.
This is not the end of software, but a reordering of it. The winners are unlikely to be those with the most polished interfaces. Instead, they will be those that control proprietary data, entrenched distribution, enterprise-grade security and deep system integration. The recovery, when it comes, will be selective rather than broad-based.
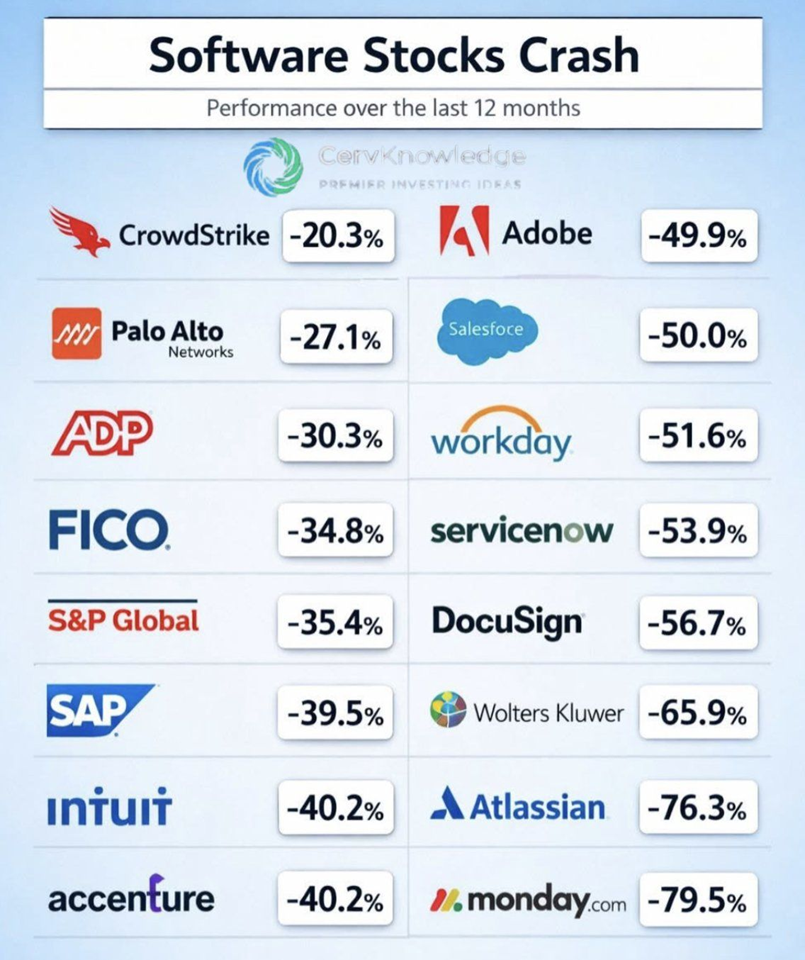
Source: Danny Naz @ThePupOfWallSt
Chart #4 —
The US dollar continues to lead all global transactions
The USD now accounts for 50.5% of international transactions processed via SWIFT, its highest share since 2023, and an increase of 11.6 percentage points over the past four years. The euro remains in second place at 21.9%, followed by the British pound at 6.7%, while the Canadian dollar and Japanese yen both stand at 3.4%.
By contrast, the Chinese yuan represents just 2.7% of transactions, a figure that has remained broadly unchanged over the past three years. Overall activity on the network continues to expand, with SWIFT processing 13.4 billion trade instructions in 2024, up from 11.9 billion in 2023.
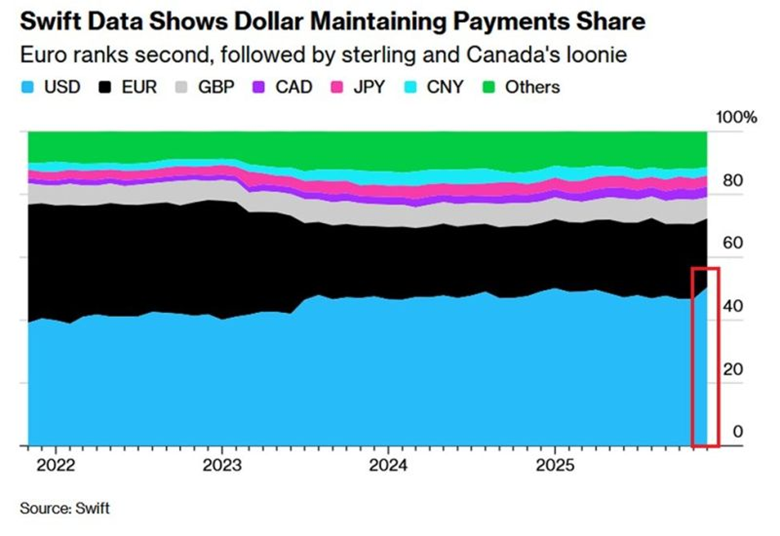
Source: Bloomberg, The Kobeissi Letter
Chart #5 —
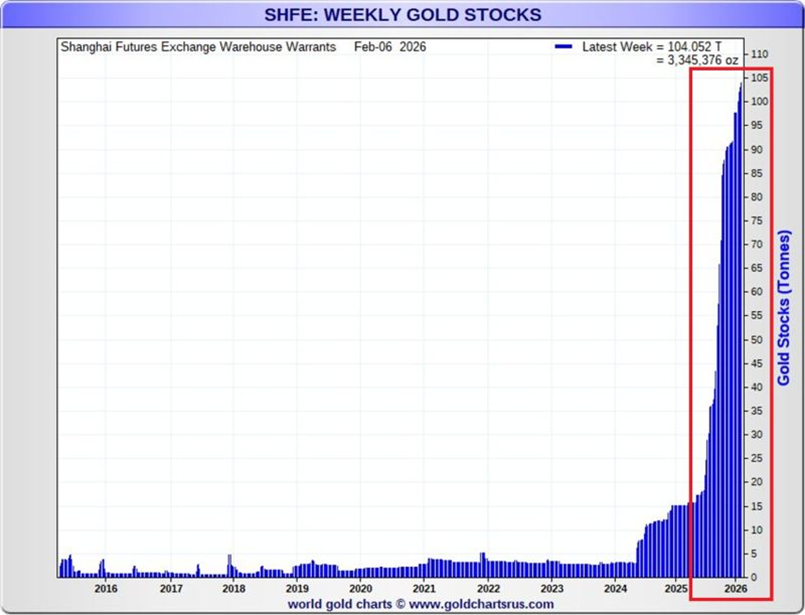
What is happening with gold in China?
Holdings of deliverable gold in Shanghai Futures Exchange vaults have surged to 104 tonnes, the highest level on record. The stock of bullion represented by warehouse warrants has expanded more than fourfold in just a few months, underscoring the speed of the buildup.
These warrants reflect physical metal stored in approved exchange vaults that can be traded, transferred or pledged as collateral. The magnitude of the increase suggests demand for physical gold in China is running at unusually elevated levels. The broader question is what is motivating such sustained accumulation.
Source: Global Markets Investor
Chart #6 —
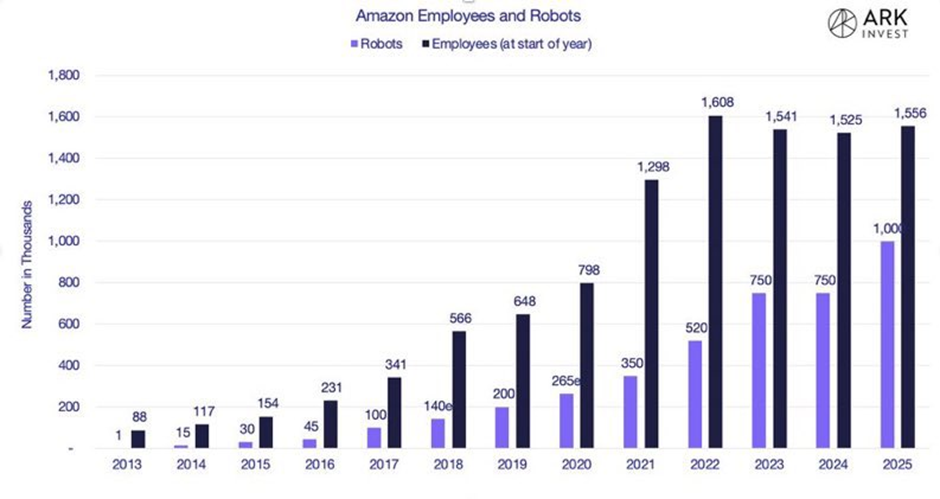
Amazon is replacing humans with robots
Amazon currently employs around 1.5 million people and has deployed about 1 million robots. The company is steadily increasing automation, with the human-to-robot ratio falling from 3:1 in 2020 to just 1.5:1 in 2025. If robots eventually outnumber employees, this could greatly boost margins by improving efficiency and reducing labour costs.
Source: Oguz Erkan, Ark Invest
Chart #7 —
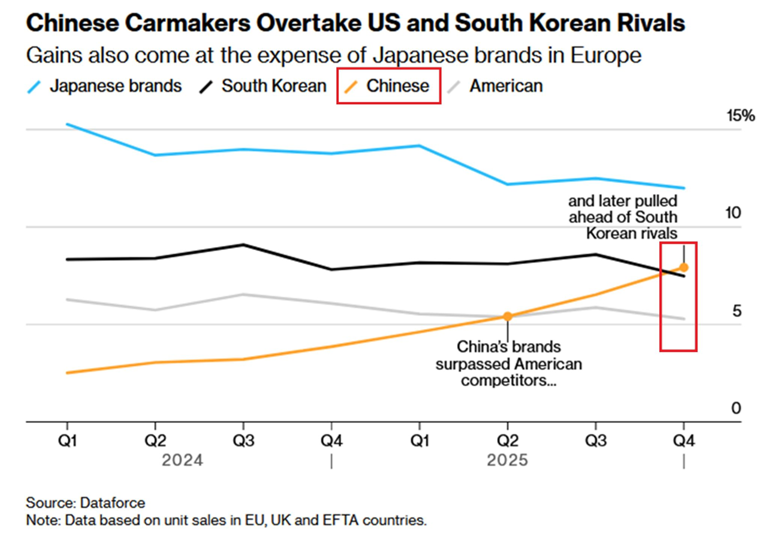
Chinese carmakers are taking over Europe
Chinese automakers now account for a record level of around 10% of all passenger vehicle sales in Europe, surpassing both American and South Korean competitors for the first time. Their share in the electric vehicle market grew rapidly in 2025, more than doubling to reach 11%, and climbing as high as 16% in December. Although Japanese manufacturers still hold the top position with approximately 13%, China is expected to overtake them as soon as 2026 if this trend continues. Overall, China is becoming an increasingly dominant force in the global automotive industry.
Source: Bloomberg
Disclaimer
This marketing document has been issued by Bank Syz Ltd. It is not intended for distribution to, publication, provision or use by individuals or legal entities that are citizens of or reside in a state, country or jurisdiction in which applicable laws and regulations prohibit its distribution, publication, provision or use. It is not directed to any person or entity to whom it would be illegal to send such marketing material. This document is intended for informational purposes only and should not be construed as an offer, solicitation or recommendation for the subscription, purchase, sale or safekeeping of any security or financial instrument or for the engagement in any other transaction, as the provision of any investment advice or service, or as a contractual document. Nothing in this document constitutes an investment, legal, tax or accounting advice or a representation that any investment or strategy is suitable or appropriate for an investor's particular and individual circumstances, nor does it constitute a personalized investment advice for any investor. This document reflects the information, opinions and comments of Bank Syz Ltd. as of the date of its publication, which are subject to change without notice. The opinions and comments of the authors in this document reflect their current views and may not coincide with those of other Syz Group entities or third parties, which may have reached different conclusions. The market valuations, terms and calculations contained herein are estimates only. The information provided comes from sources deemed reliable, but Bank Syz Ltd. does not guarantee its completeness, accuracy, reliability and actuality. Past performance gives no indication of nor guarantees current or future results. Bank Syz Ltd. accepts no liability for any loss arising from the use of this document.
Related Articles
Meanwhile, hedging allows oil producers to lock in profits. Each week, the Syz investment team takes you through the last seven days in seven charts.
Meanwhile, precious metals are plummeting. Each week, the Syz investment team takes you through the last seven days in seven charts.
The hot commodity of the week: oil. Each week, the Syz investment team takes you through the last seven days in seven charts.