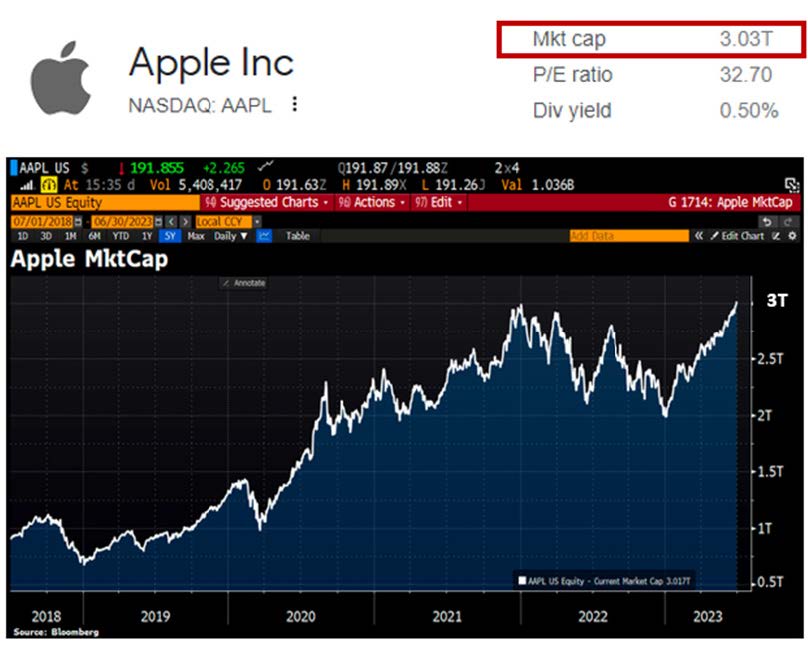
Chart #2 —
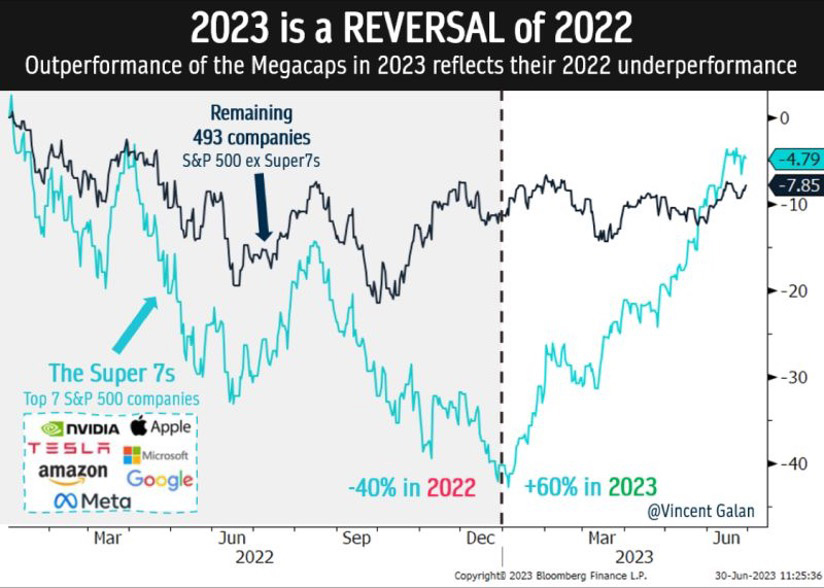
The S&P 500 is divided into 2 groups
On one side, the Super 7 (or the Magnificent 7: Apple, Nvidia, Tesla, Microsoft, Amazon, Alphabet, Meta). On the other, the 493 stocks that make up the S&P 500 index. The performance of these 2 groups diverges significantly, both in 2022 and since the start of 2023. Indeed, the massive outperformance of the Super 7s in 2023 is in some ways a mirror image of their equally massive underperformance in 2022.
If we add up the performance of 2022 and the first half of 2023, however, we see that both groups are still in the red, with a decline of -5% for the Super 7 and -8% for the S&P 493.
Source: Vincent Galan, Bloomberg
Chart #3 —
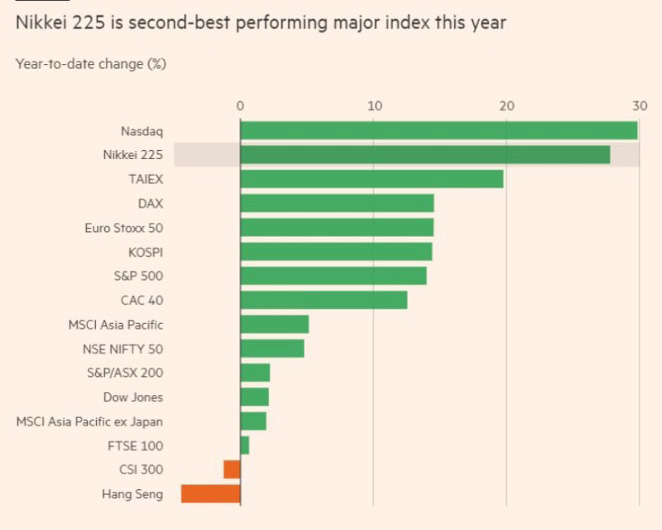
The Nasdaq and Nikkei 225 indices were the best stock market performers in the 1st half of the year
The Nasdaq emerged as the world's leading stock market index this year (+30%), closely followed by the Nikkei 225, which climbed 27%. The broader Topix index, which focuses more on domestic banks and companies, also posted substantial gains, up 21% This was its best half-year performance since 2016.
Source: FT
Chart #4 —
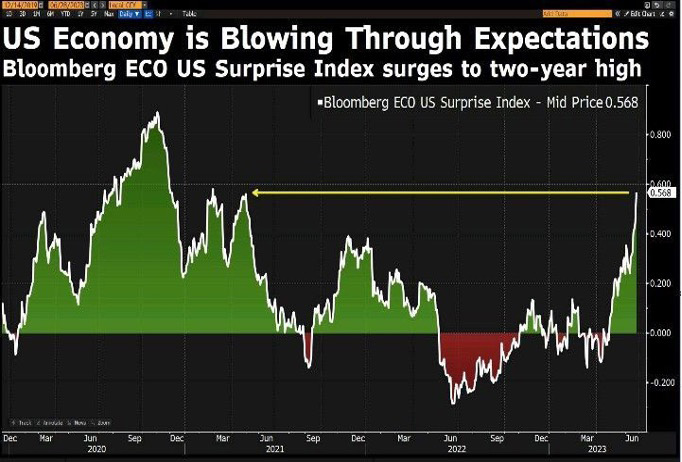
The US economy continues to surprise on the upside
US economic statistics continue to exceed consensus expectations. The Bloomberg US Economic Surprise Index is at a 2-year high.
Source: Bloomberg
Chart #5 —
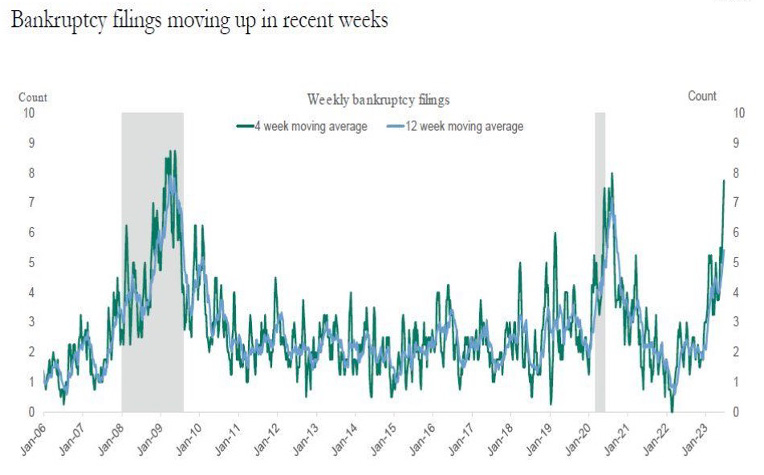
Bankruptcies soar in the US
Here's a chart that contradicts the previous one. Bankruptcy filings in the US continue to rise. The policy of very low interest rates had enabled many struggling companies to continue to survive - a phenomenon known as "zombification". With rising interest rates, bankruptcy has become inevitable for many companies.
Source: Apollo
Chart #6 —
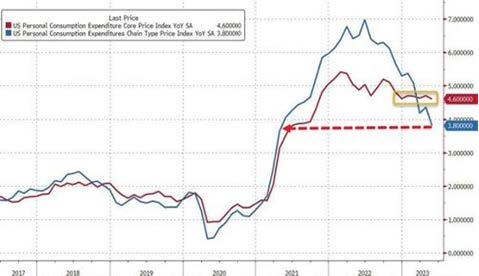
US inflation continues to fall
The Fed's preferred inflation indicator shows that the US inflation rate is at its lowest since April 2021. The PCE deflator reached 3.8% year-on-year in May, compared with 4.3% in April and in line with consensus expectations. The core PCE deflator unexpectedly slowed to 4.6% year-on-year in May (from 4.7% previously). However, it remains well above the Fed's 2% target.
Source: Bloomberg, www.zerohedge.com
Chart #7 —
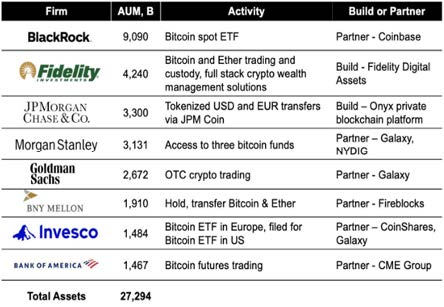
More and more major asset managers aspire to launch a bitcoin ETF
BlackRock's recent filing with the SEC for the launch of a spot ETF on bitcoin has "created a buzz" over the past 2 weeks. We note that many major financial institutions in the US are actively engaged in efforts to facilitate access to bitcoin and other crypto-currencies. These institutions collectively manage $27,000 billion in assets.
Source: Meltem Demirors
Disclaimer
This marketing document has been issued by Bank Syz Ltd. It is not intended for distribution to, publication, provision or use by individuals or legal entities that are citizens of or reside in a state, country or jurisdiction in which applicable laws and regulations prohibit its distribution, publication, provision or use. It is not directed to any person or entity to whom it would be illegal to send such marketing material. This document is intended for informational purposes only and should not be construed as an offer, solicitation or recommendation for the subscription, purchase, sale or safekeeping of any security or financial instrument or for the engagement in any other transaction, as the provision of any investment advice or service, or as a contractual document. Nothing in this document constitutes an investment, legal, tax or accounting advice or a representation that any investment or strategy is suitable or appropriate for an investor's particular and individual circumstances, nor does it constitute a personalized investment advice for any investor. This document reflects the information, opinions and comments of Bank Syz Ltd. as of the date of its publication, which are subject to change without notice. The opinions and comments of the authors in this document reflect their current views and may not coincide with those of other Syz Group entities or third parties, which may have reached different conclusions. The market valuations, terms and calculations contained herein are estimates only. The information provided comes from sources deemed reliable, but Bank Syz Ltd. does not guarantee its completeness, accuracy, reliability and actuality. Past performance gives no indication of nor guarantees current or future results. Bank Syz Ltd. accepts no liability for any loss arising from the use of this document.
Related Articles
Interest expenses soar in the US while ECB and SNB cut rates. Each week, the Syz investment team takes you through the last seven days in seven charts.
Bitcoin rings the bell at $100,000 and continues to deliver massive ETF inflows, while global debt hits a new high. Each week, the Syz investment team takes you through the last seven days in seven charts.
France grapples with a massive debt yield ahead of next year’s budget, while the S&P 500 surges by $10 trillion this year. Each week, the Syz investment team takes you through the last seven days in seven charts.


.png)
