Charles-Henry Monchau

Chief Investment Officer

Chart #1 — 

An overall positive month of April for US equities  

Equity markets performed slightly better last week, as the focus shifted to corporate earnings. Indeed, 35% of the companies in the S&P 500 Index, or 44% of its market capitalization, were due to report earnings during the week.
Meta and Microsoft jumped, while other GAFAs had mixed performances.
For the month, the Nasdaq closed at the same level as at the beginning of the period, while the Dow Jones recorded a +2.2% increase. Small caps, represented by the Russell 2000 Index, underperformed (-1.9%).
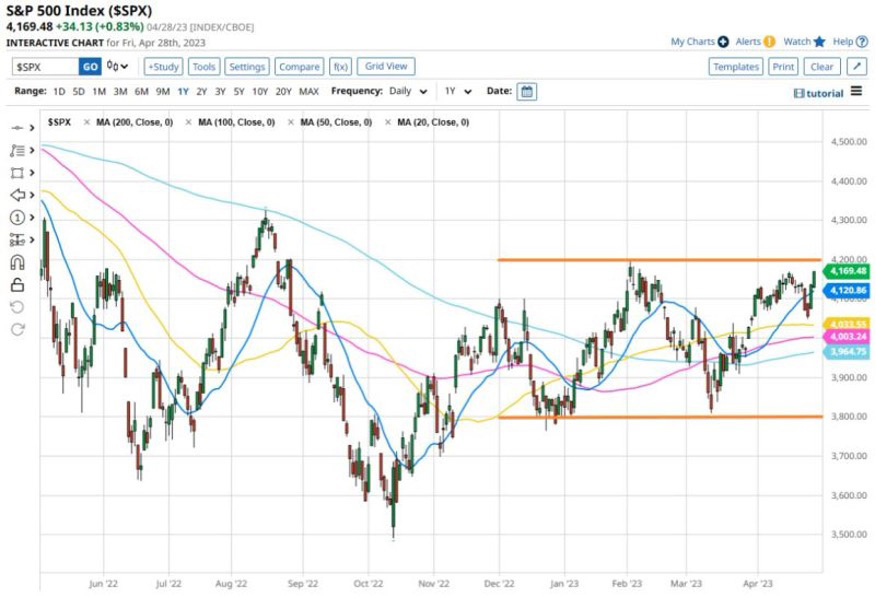
The S&P 500 Index gained 1.2% over the month. From a technical standpoint, it is now moving above the 200-, 100-,
50- and 20-day moving averages. However, the S&P 500 is still not out of the consolidation tunnel it has been in since
the end of last year.
Despite the banking crisis, US debt CDS at an all-time high and an ongoing rate hike cycle in the US, the major equity
indices do not seem to want to weaken. How can this be explained? Goldman Sachs has suggested 5 possible
explanations:

1.    Economic growth is normalizing, with the rate of growth now close to that of the last decade.
2.    Inflation continues to decelerate. Core PCE for March fell from +0.35% in February to +0.28% in March
(sequential).
3.    The supply chain appears to be unclogging
4.    Volatility is easing. The VIX index fell back below 16 on Friday for the first time since 2021.
5.    Earnings are better than expected. In addition to the relative strong results of the tech mega-caps, banks, aircraft manufacturers, industrial companies (in general), airlines (for the most part) and even toy manufacturers have posted better-than-expected or even excellent results.
pic 1-May-01-2023-01-29-16-9413-PMSource: www.zerohedge.com, Bloomberg


Chart #2 — 

Only very few stocks have participated in the rise of the US market since the beginning of the year 


While the S&P 500 and Nasdaq indices have performed remarkably well since the beginning of the year, only a very limited number of stocks have contributed to the indices' advance.
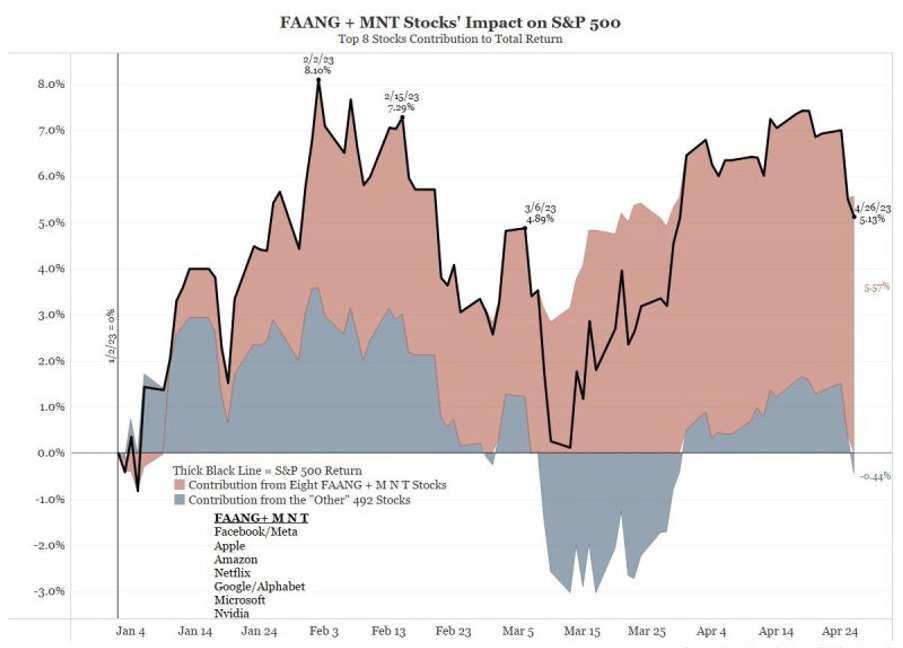
A performance contribution analysis conducted by Bianco Research as of April 26 highlights the following figures:
Eight stocks (Meta, Apple, Amazon, Netflix, Microsoft, Alphabet, Nvidia and Tesla) contributed +5.57% of the S&P 500's +5.13% performance. The remaining 492 stocks in the index contributed -0.44% to the index's performance.


pic 2-May-01-2023-01-31-25-3458-PM

Source: Bianco Research 


Chart #3 — 

A new victim of the banking crisis in the United States 


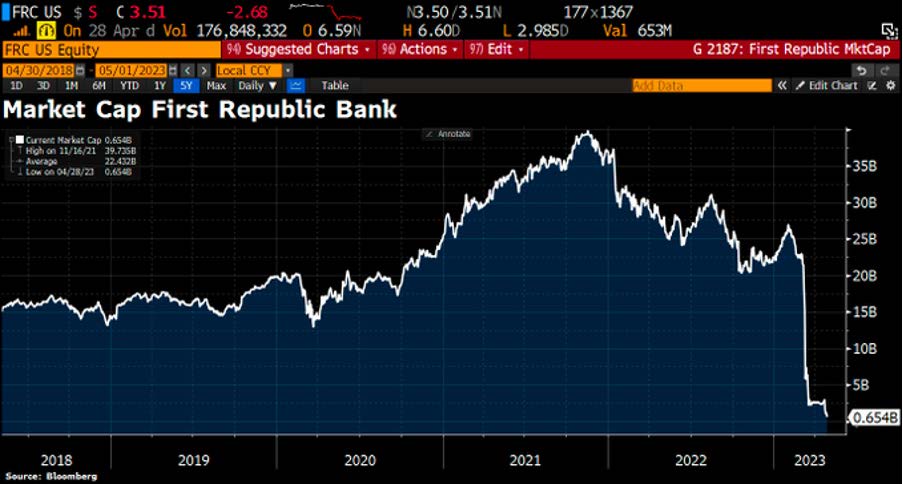
Curtain falls on the 14th largest bank in the United States! First Republic Bank (FRC), with assets of more than $212 billion as of December 31, 2022, will be taken over by the FDIC, as rescue options dwindle.
After the failure of Silicon Valley Bank (SVB), some banks faced huge customer withdrawals; FRC is one of them. In an attempt to rescue FRC, major banks, including JPM, injected more than $30 billion to stabilize its operations, but FRC did not survive.
Banks are now facing not a solvency crisis but a liquidity crisis, the result of the fastest rate hike cycle since the 1980s. 
On Monday morning, JPMorgan announced it is acquiring all of First Republic’s deposits and a “substantial majority of assets.” It came after the Californian financial regulator took possession of First Republic, resulting in the third failure of an American bank since March.
First Republic Bank has lost 98% of its value since its all-time high. More bank failures could follow.        

pic 3-May-01-2023-01-33-56-4354-PMSource: Bloomberg


Chart #4 — 

Rampant “greedflation” in the consumer goods sector


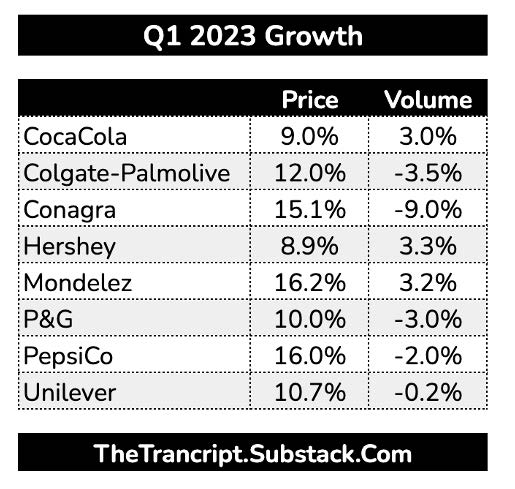
Greedflation is the tendency of companies to take advantage of rising prices to generate excessive profits. The idea is simple: when world prices rose due to supply and demand, companies raised their prices. But they didn't just raise them to cover higher costs. They have fuelled inflation with price increases that go beyond the rise in raw material costs and wages, pushing their revenues to record levels.
This phenomenon is clearly visible in the earnings reports of consumer companies in the US. As shown in the table below, these companies are showing strong average price increases in Q1 2023 (vs. Q1 2022). In contrast, volumes are suffering, reflecting the inability of consumers to maintain their purchase quantity due to higher prices. It is difficult to believe that companies will be able to continue to improve their sales in this high price environment.

pic 4-May-01-2023-01-35-47-1809-PM

Source: The Transcript.Substack.com


Chart #5 — 

Sell in May and Go Away?

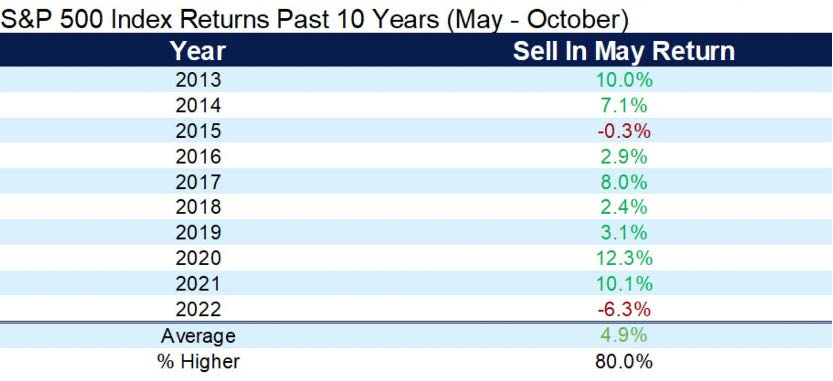
The famous saying "Sell in May and Go away" refers to the seasonal decline in the equity markets starting in May. Indeed, the May-October period is not historically good for equity markets, which have only gained an average of 1.7% (S&P 500), but over the past decade, the performance of this six-month period has only underperformed the November-April period twice and has gained an average of almost 5%.

pic 6-May-01-2023-01-38-55-2911-PM

Source: Ryan Detrick


Chart #6 — 

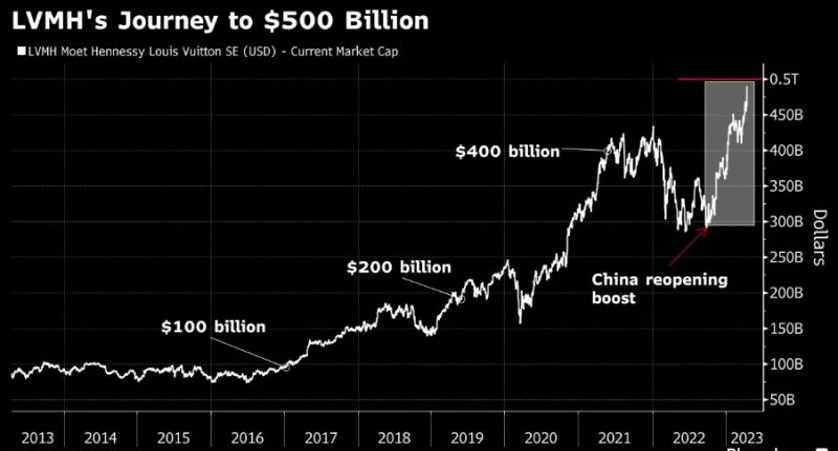
LVMH first European stock to reach 500 billion in market capitalization 


Luxury goods giant LVMH becomes the first European company to surpass $500 billion in market value, thanks to booming luxury goods sales in China and a strengthening euro. The result comes less than two weeks after LVMH joined the ranks of the world's 10 largest companies.
The parent company of Louis Vuitton, Moët & Chandon and Hennessy, as well as brands such as Givenchy, Bulgari and Sephora stores, reported a 17 percent increase in first-quarter revenue earlier this month, more than doubling analysts' expectations. The company's shares hit a record high following these results, and another high was reached on Monday.

pic 7-May-01-2023-01-59-27-3583-PM

Source: Bloomberg


Chart #7 — 

Cash is king


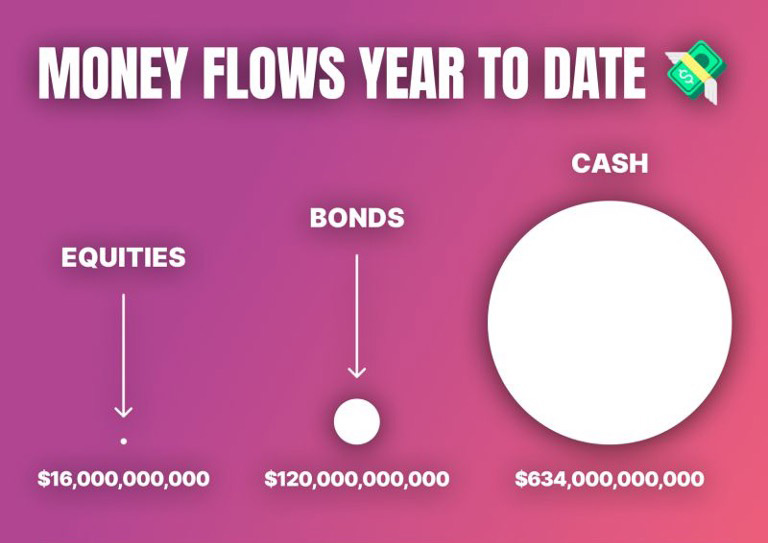
Money market investments have been popular with investors since the beginning of the year.  According to Bank of America, money market funds have seen $634 billion in inflows since the beginning of 2023 (up from $11 billion in 2022). Bond funds have seen $120 billion in inflows since the beginning of the year, compared to $258 billion in bond outflows in 2022. Equity markets, meanwhile, have seen $16 billion in inflows year-to-date (versus $175 billion in 2022).It would seem that the high interest rates offered by money market funds are a real competition for stocks and bonds. 

pic 8-2Source: Ignacio Ramirez Moreno

Disclaimer

This marketing document has been issued by Bank Syz Ltd. It is not intended for distribution to, publication, provision or use by individuals or legal entities that are citizens of or reside in a state, country or jurisdiction in which applicable laws and regulations prohibit its distribution, publication, provision or use. It is not directed to any person or entity to whom it would be illegal to send such marketing material. This document is intended for informational purposes only and should not be construed as an offer, solicitation or recommendation for the subscription, purchase, sale or safekeeping of any security or financial instrument or for the engagement in any other transaction, as the provision of any investment advice or service, or as a contractual document. Nothing in this document constitutes an investment, legal, tax or accounting advice or a representation that any investment or strategy is suitable or appropriate for an investor's particular and individual circumstances, nor does it constitute a personalized investment advice for any investor. This document reflects the information, opinions and comments of Bank Syz Ltd. as of the date of its publication, which are subject to change without notice. The opinions and comments of the authors in this document reflect their current views and may not coincide with those of other Syz Group entities or third parties, which may have reached different conclusions. The market valuations, terms and calculations contained herein are estimates only. The information provided comes from sources deemed reliable, but Bank Syz Ltd. does not guarantee its completeness, accuracy, reliability and actuality. Past performance gives no indication of nor guarantees current or future results. Bank Syz Ltd. accepts no liability for any loss arising from the use of this document.

Read More

Straight from the Desk

Syz the moment

Live feeds, charts, breaking stories, all day long.

Thinking out loud

Sign up for our weekly email highlighting the most popular posts.

Follow us

Thinking out loud

Investing with intelligence

Our latest research, commentary and market outlooks