Charles-Henry Monchau

Chief Investment Officer

Chart #1 — 

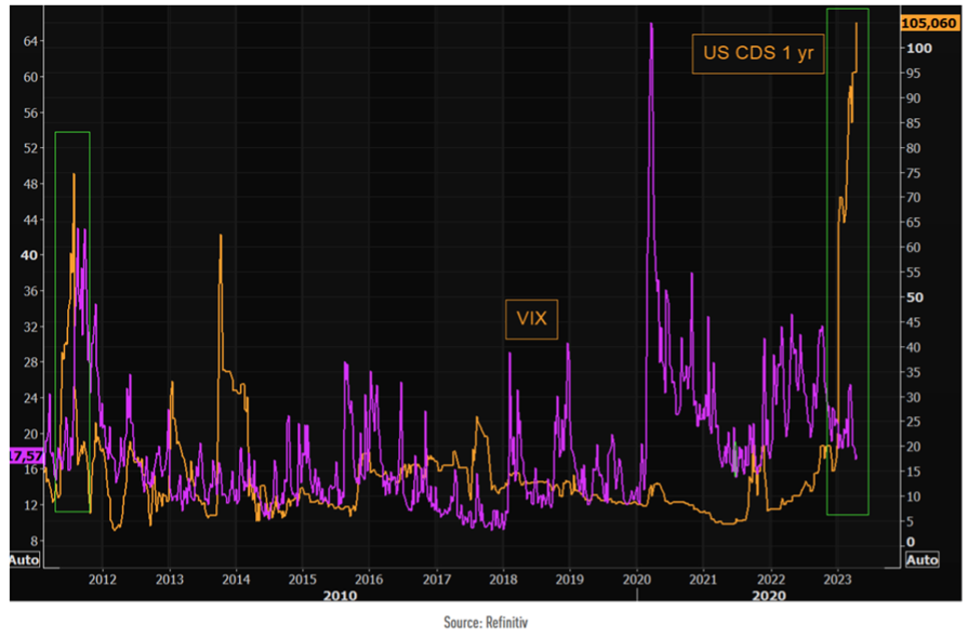
The dichotomy between the VIX index and one-year CDS on US debt  

The major U.S. stock market indices posted mixed performances over the past week. While the S&P 500 and Nasdaq closed slightly lower on the week, the VIX index of implied volatility for the S&P 500 reached its lowest level since the end of 2021. A low VIX level is a signal of investor complacency.  

However, some market indicators seem much less serene. This is the case of the one-year Credit Default Swap (CDS) on US debt (in yellow below), a derivative product whose price reflects the premium required to insure against the possible default of a debt (that of the US in this case). 

The possibility of a "technical default" by the US on its debt has been raised in the markets. Indeed, the US debt ceiling (which is set by law) is expected to be reached at some point in the coming months. While a new bill must be passed by both the House of Representatives (controlled by Republicans) and the Senate (controlled by Democrats) to raise the debt ceiling, there is currently no agreement between the two chambers. Without new legislation, the U.S. risks defaulting on some of its debt later this summer, if not sooner. The debate over the debt ceiling and concerns about it will likely intensify as the deadline approaches. By then, and perhaps beyond, concerns about a U.S. technical default could continue to grow. 

As in previous occurrences (particularly summer 2011), this event will likely bring volatility to financial markets, with downward pressure on U.S. Treasury securities maturing over the summer, whose repayment could be delayed until the debt limit is finally raised. At this stage, US CDS and the Treasury curve (see chart #2) are the assets that partially incorporate this risk. Conversely, equity markets seem to be little affected, despite the negative impact of this type of event in the past (see chart #3). 
Picture1-Apr-24-2023-02-46-39-9207-PM

Source: TME, Refinitiv 


Chart #2 — 

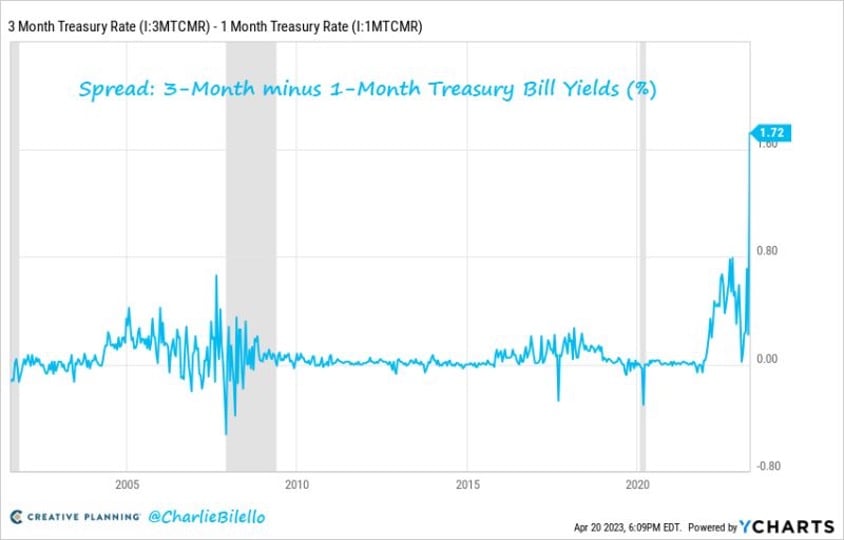
The spread between 3-month and 1-month U.S. Treasury yields hits an all-time high 


The risk associated with the US debt ceiling is also reflected in the US Treasury yield curve. The spread between the yields on 3-month (5.12%) and 1-month (3.40%) Treasuries has never been higher: 1.72%. Indeed, the yield on US Treasuries maturing before May is much lower than it should be given the current level of the Fed Funds rate: less than 4% against a Fed Funds rate already close to 5%. This "premium" is probably linked to the fact that, for T-Bills maturing before the end of May, there is no uncertainty linked to the debt ceiling, since the US Treasury will have the necessary liquidity to meet principal repayments.

But starting in June, the risk of the debt ceiling being breached increases, triggering a rise in yields, as Treasuries pay roughly the same as Fed Funds. 

Picture2-Apr-24-2023-02-47-58-2477-PM

Source: Charlie Bilello


Chart #3 — 

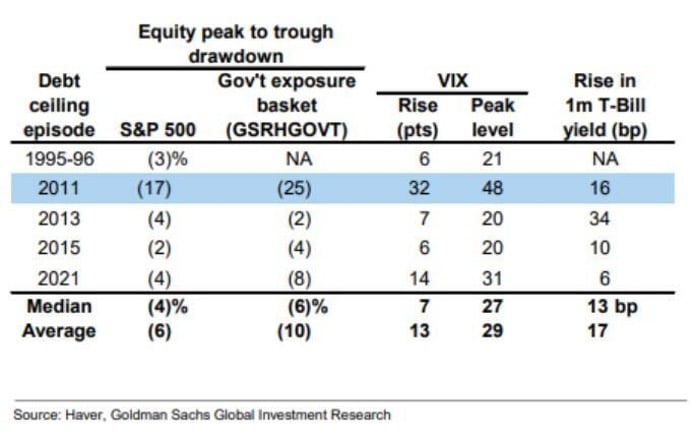
How did equity markets perform during previous debt ceiling crisis episodes?


A note by David Kostin (Goldman Sachs) on stock performance during previous debt ceiling episodes shows that during the 2011 Republican-Democrat showdown, the S&P 500 fell 17% from peak to trough, or 22 trading sessions.

Picture3-Apr-24-2023-02-49-05-2507-PM

Source: Goldman Sachs


Chart #4 — 

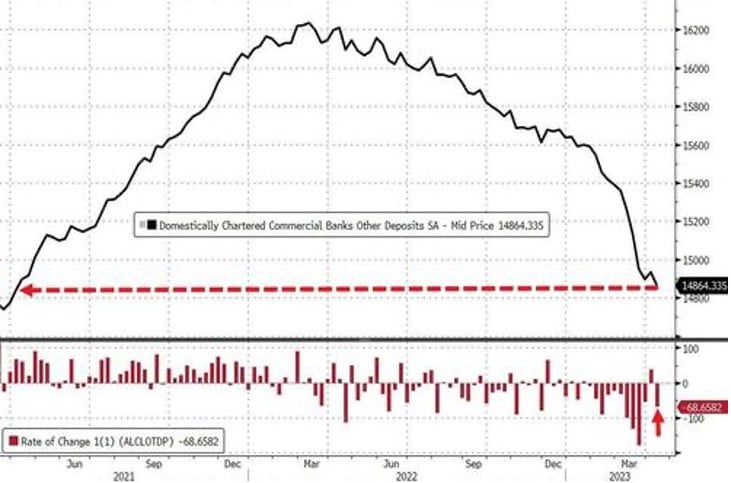
Deposits at U.S. banks continue to fall 


The banking crisis in the United States may not be over. Deposits at U.S. commercial banks unexpectedly fell during the week of April 12, dropping about $70 billion to the lowest level since April 2021. Large banks experienced the largest outflows.

Picture4-Apr-24-2023-02-50-34-1136-PM

Source: Bloomberg, www.zerohedge.com 


Chart #5 — 

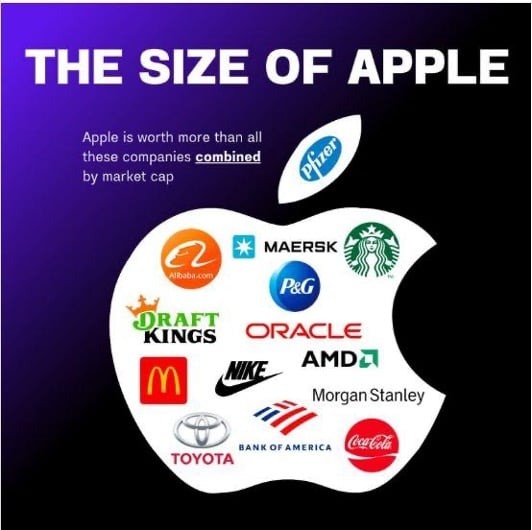
Apple continues its foray into financial services 

Apple announced last week the launch of a savings account via a partnership with Goldman Sachs. After Apple Pay, Apple Card and Apple Buy Now Pay Later, it is now possible to get a relatively attractive interest rate (currently 4.15%) on cash deposited in an Apple savings account. The "timing" of the announcement, just after the collapse of SVB and at a time when savers are shifting their cash held with commercial banks to money market funds seems timely. With 1.8 billion devices (iPhone, iPad, etc.) active worldwide, Apple has the potential to disrupt the banking industry. The Cupertino-based firm also benefits from its financial strength: Apple's market capitalization $2.6 trillion is $500 billion larger than Microsoft's and much larger than other listed companies (see below). Apple's share price has risen by +305% over the last 5 years. 

Picture5-Apr-24-2023-02-51-30-4402-PM

Source: Oktay Kavrak, CFA, Leveraged Shares


Chart #6 — 

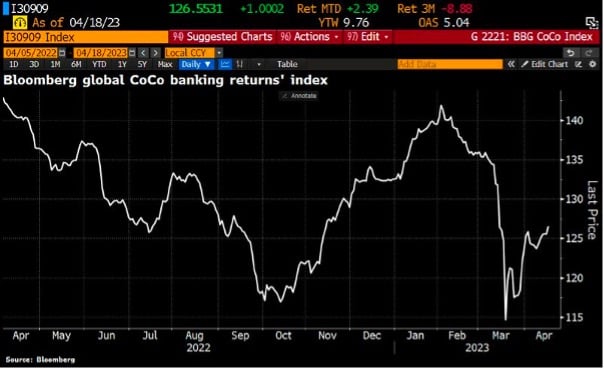
CoCo bond issues are coming back to life 


The CoCo bond market (or AT1 paper) is making a comeback with the first AT1 bond issue, a large issue from a Japanese bank, just weeks after the collapse of Credit Suisse. The CoCo bond index has returned to the level it was at just before the Credit Suisse rescue. Sumitomo Mitsui Financial Group Inc. successfully sold 140 billion yen ($1 billion) of AT1 bonds on Wednesday. 

Picture6-Apr-24-2023-02-52-28-4145-PM

Source: Bloomberg


Chart #7 — 

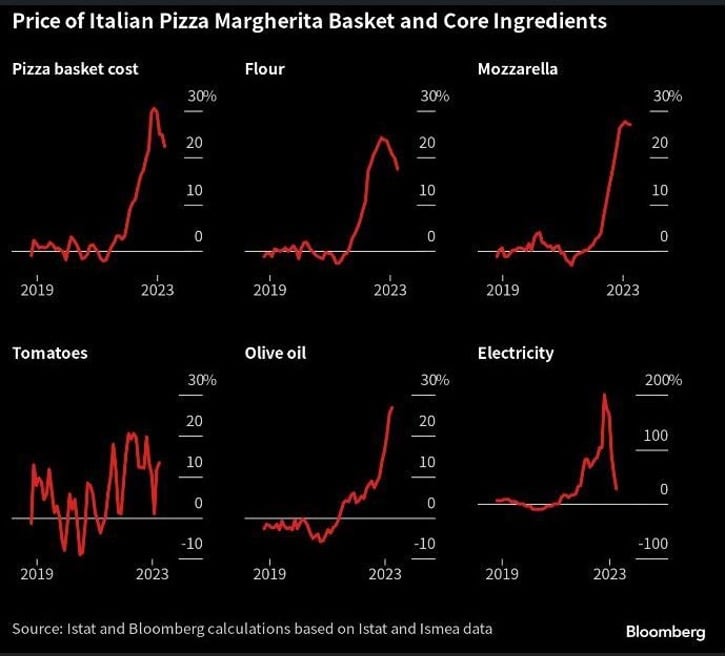
The “Pizza Margherita” inflation index  


The preparation of a pizza requires a number of raw materials and of course, a cooking source that is dependent on energy prices. As the graph below shows, the price of many ingredients continue to rise. Only the price of the electricity needed to run the pizza oven is falling sharply. So, we have to be prepared to pay even more for our pizzas...

Picture7-Apr-24-2023-02-53-22-7343-PM

Source: Bloomberg, Bruno Puricelli

Disclaimer

This marketing document has been issued by Bank Syz Ltd. It is not intended for distribution to, publication, provision or use by individuals or legal entities that are citizens of or reside in a state, country or jurisdiction in which applicable laws and regulations prohibit its distribution, publication, provision or use. It is not directed to any person or entity to whom it would be illegal to send such marketing material. This document is intended for informational purposes only and should not be construed as an offer, solicitation or recommendation for the subscription, purchase, sale or safekeeping of any security or financial instrument or for the engagement in any other transaction, as the provision of any investment advice or service, or as a contractual document. Nothing in this document constitutes an investment, legal, tax or accounting advice or a representation that any investment or strategy is suitable or appropriate for an investor's particular and individual circumstances, nor does it constitute a personalized investment advice for any investor. This document reflects the information, opinions and comments of Bank Syz Ltd. as of the date of its publication, which are subject to change without notice. The opinions and comments of the authors in this document reflect their current views and may not coincide with those of other Syz Group entities or third parties, which may have reached different conclusions. The market valuations, terms and calculations contained herein are estimates only. The information provided comes from sources deemed reliable, but Bank Syz Ltd. does not guarantee its completeness, accuracy, reliability and actuality. Past performance gives no indication of nor guarantees current or future results. Bank Syz Ltd. accepts no liability for any loss arising from the use of this document.

Read More

Straight from the Desk

Syz the moment

Live feeds, charts, breaking stories, all day long.

Thinking out loud

Sign up for our weekly email highlighting the most popular posts.

Follow us

Thinking out loud

Investing with intelligence

Our latest research, commentary and market outlooks