

.png)
Story #1 —
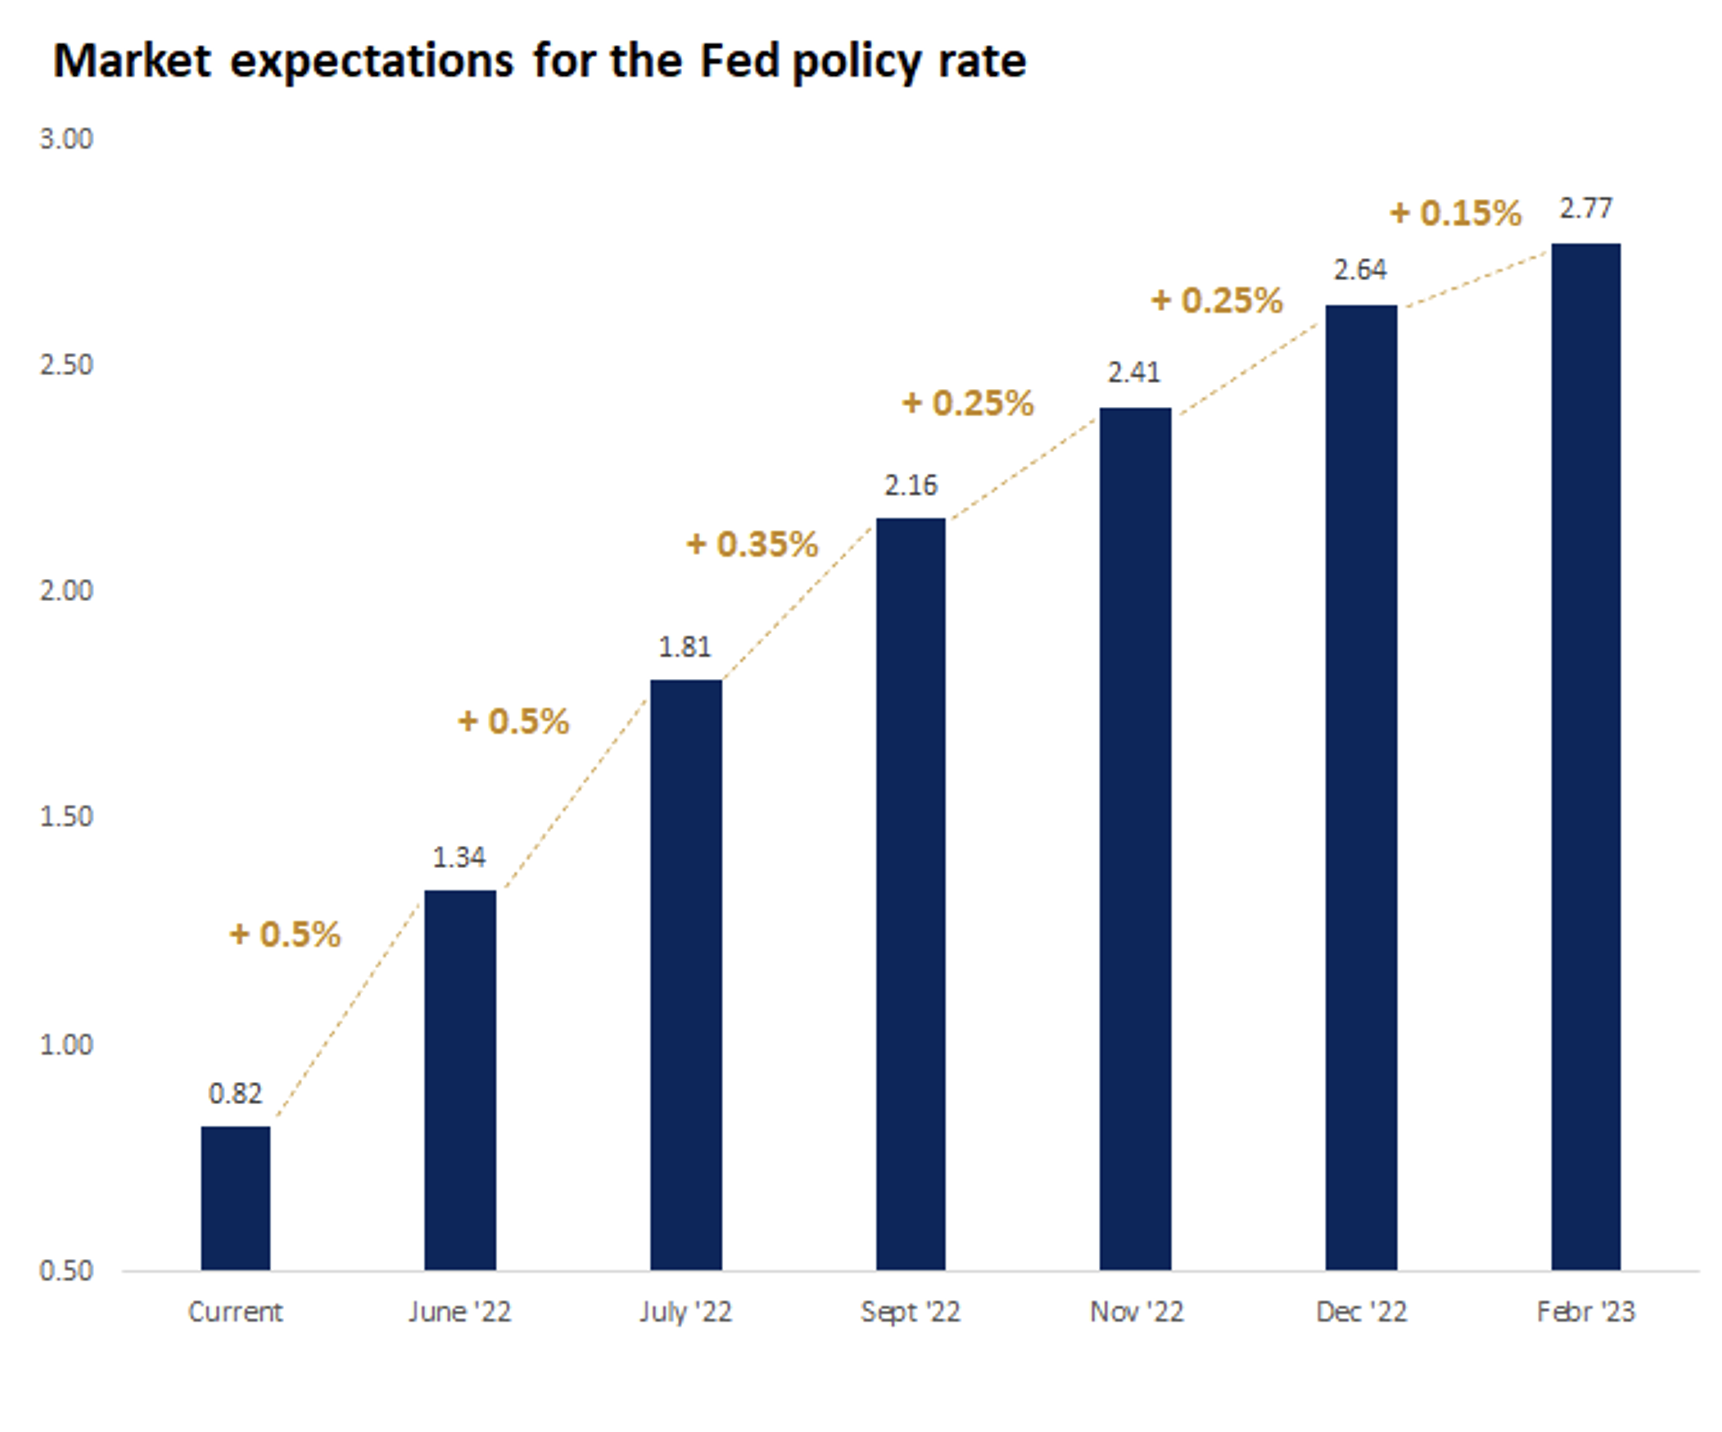
The Fed’s 50 basis points hike
The US Federal Reserve increased rates by 50 basis points in May. The hike was well signaled by Fed officials and in line with market expectations. As such, it did not prompt any substantial movements in US bond yields. The market is now pricing in another two subsequent 50bps hikes in June and July. We note that the tone of the Fed has been evolving over the month. While Fed Chairman Jerome Powell initially adopted a hawkish tone stating the Fed wouldn’t hesitate to raise rates beyond neutral, the message from the Fed became more mixed towards the end of the month probably due to the deterioration of some macro data (see next stories). The probability, as given by the market, of a 50bps hike in June is now less than 100%.
Source: Edward Jones, Bloomberg
Story #2 —
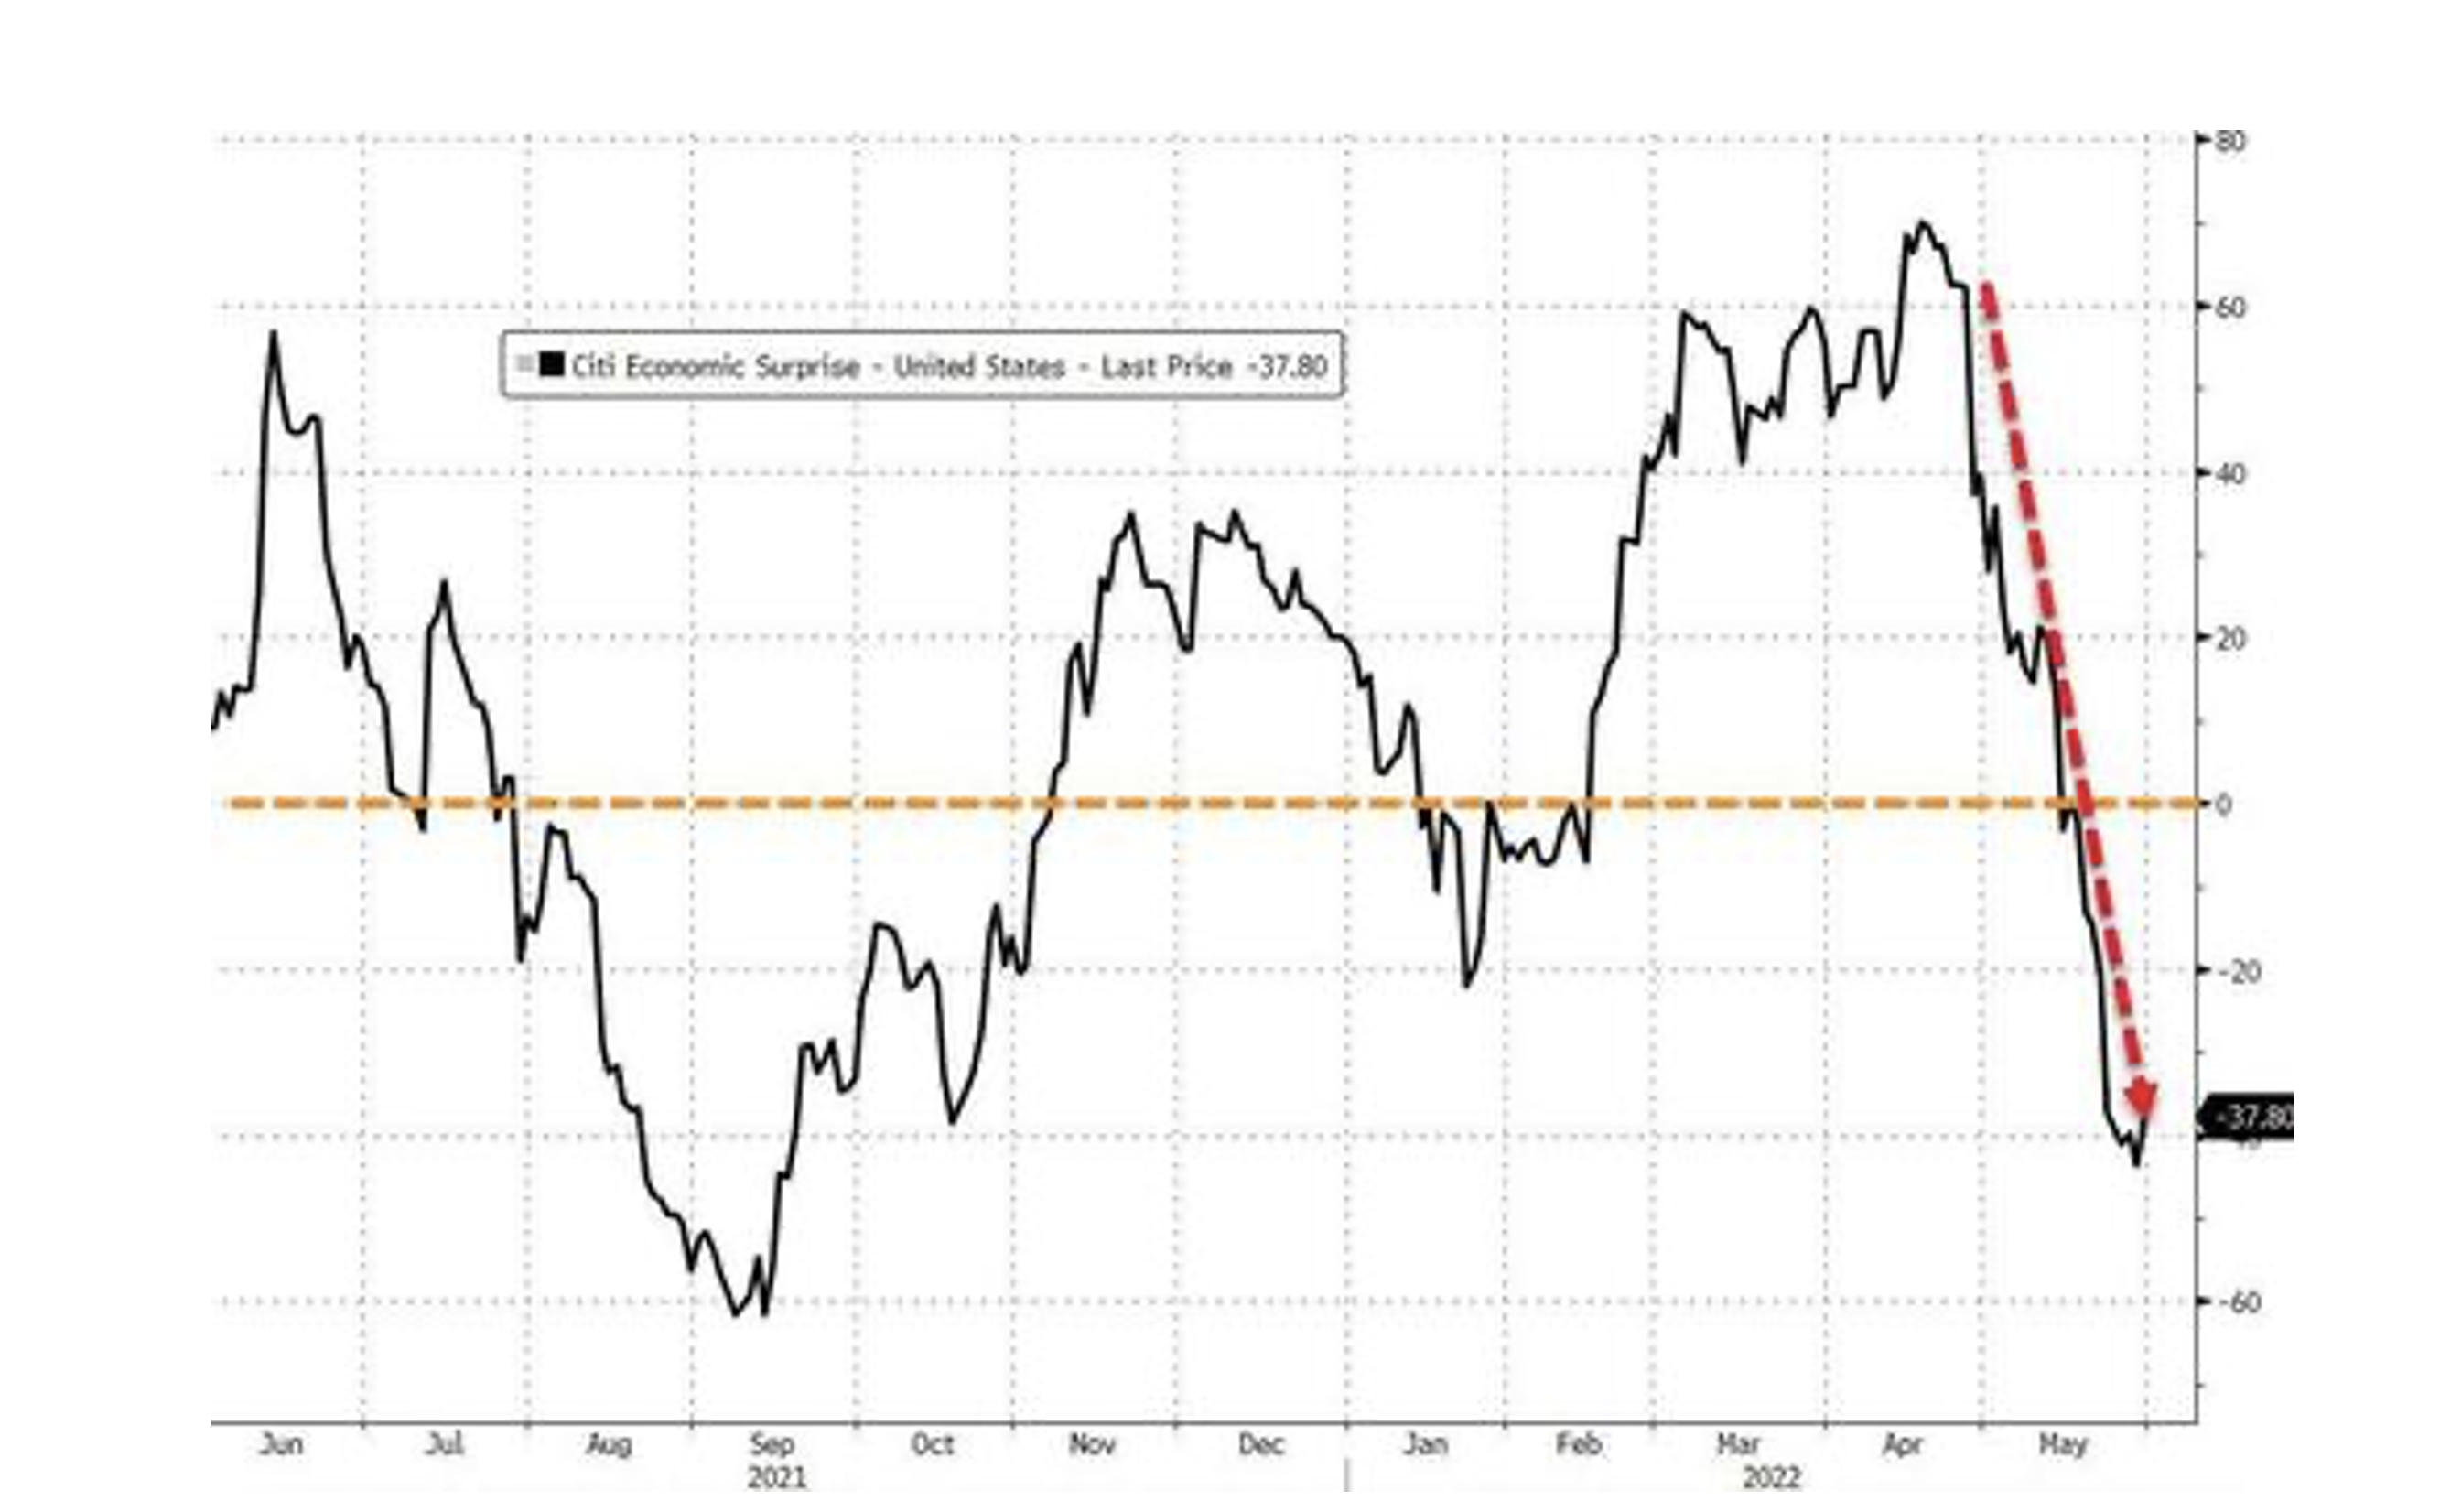
Bad news is becoming good news again
Recently released macroeconomic figures were below investors' expectations. For instance, the US economic surprise indicators point to a sharp slowdown in US growth. To put the numbers in context, except for the April 2020 crash (when the US shut down its entire economy), May 2022's collapse in US Macro Surprise data was the worst since October 2008 in the immediate aftermath of the Lehman Bros. crisis and the subsequent freezing of all capital markets. These figures suggest a lower than expected number of rate hikes, which delights the markets. Bad news becomes good news, in a way.
Source: www.zerohedge.com, Bloomberg
Story #3 —
Inflation expectations are tumbling
The Fed's preferred measure of inflation (PCE) slowed in April to +6.3% YoY compared to 6.6% in March, slightly above the expected 6.2%. This report includes an impressive asset reversal for non-durables: its price index is down from the previous month, the first negative rate since October 2020 and the largest decline since May 2020. The market is gradually adjusting inflation expectations as the five-and ten-year inflation expectations have fallen by the most since the beginning of the pandemic in recent weeks.
Story #4 —
China covid lockdowns
China continued to struggle with the Omicron variant. Shanghai spent most of May in lockdown as officials announced a gradual general reopening to take place in June. Outside of Shanghai, Covid outbreaks forced Beijing to tighten restrictions as well. These lockdowns are weighing heavily on Chinese economic activity, impacting both supply and demand. This means that it will be difficult for China to reach the annualized 5.5% real GDP growth target that has been set for 2022. The Chinese lockdowns are also likely to impact global growth, as they impact not only factory activity but also logistics with many trucks currently at a standstill, while ships are queuing outside Shanghai. Global supply chains are thus likely to be impacted, creating further upside risks for inflation and downside risks for growth.
Story #5 —
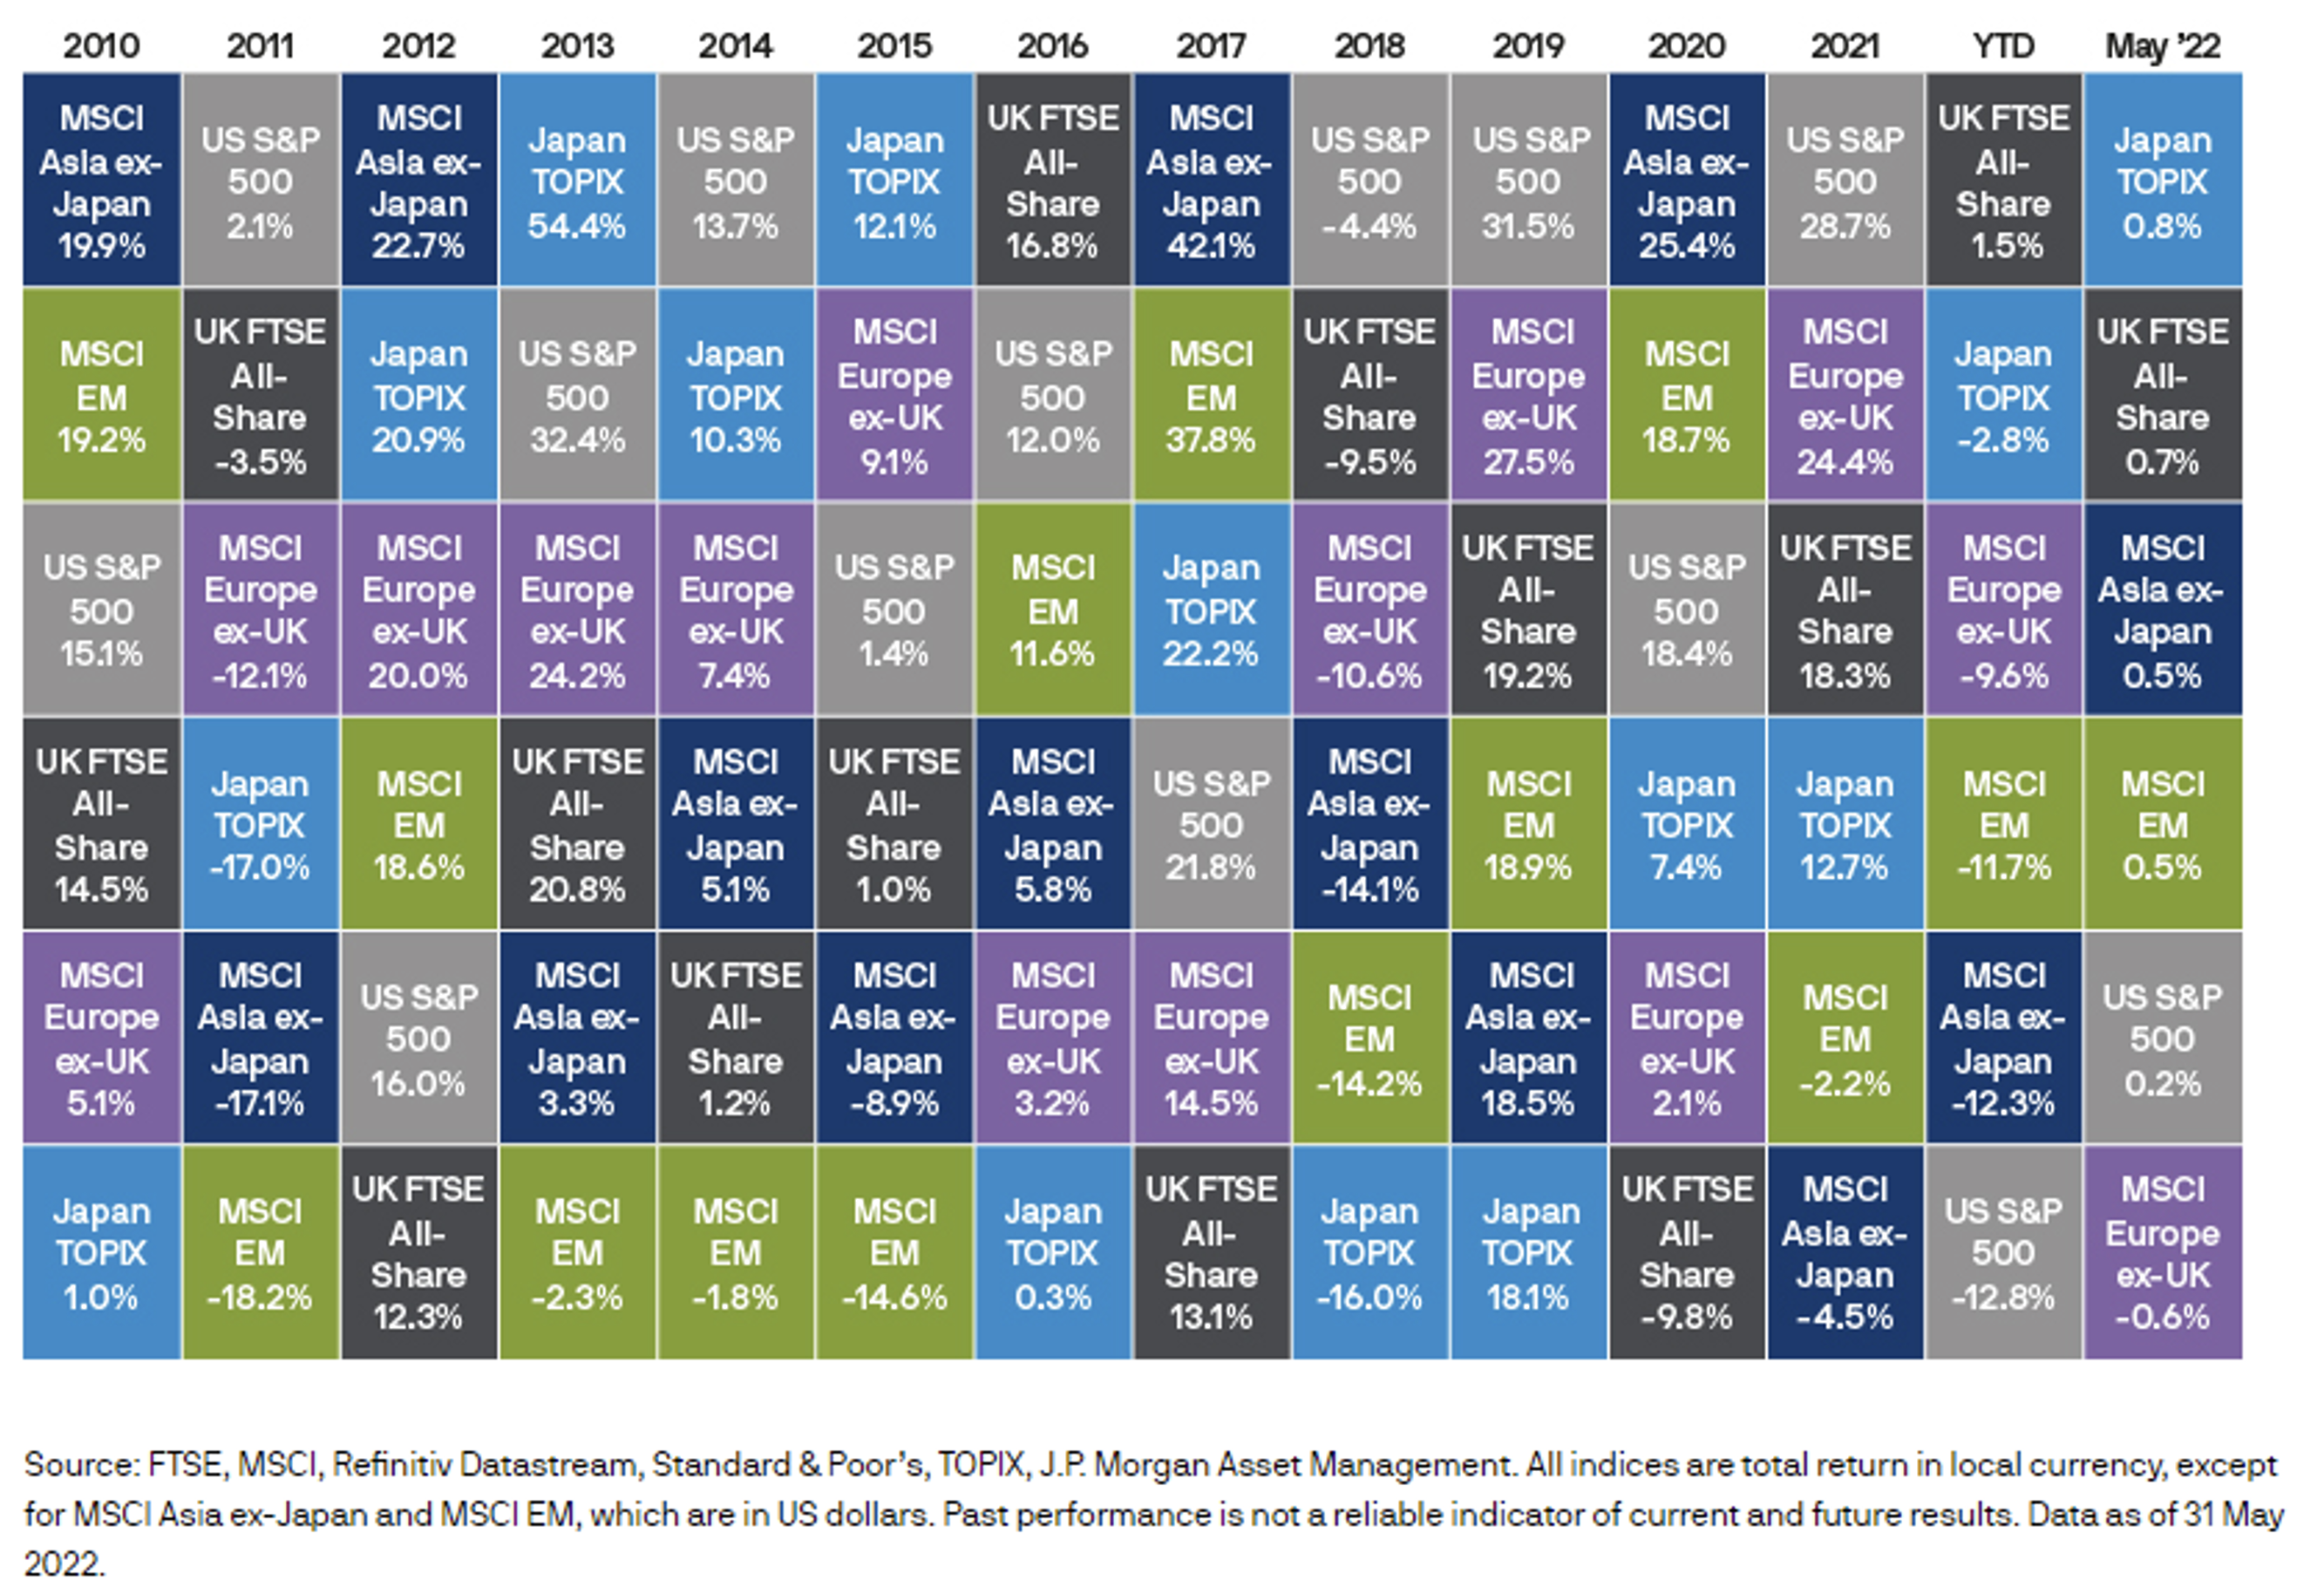
Finally a positive month for equity markets
On May 20th, the S&P 500 briefly entered a bear market, breaking the 20% threshold from its highs. The S&P broke through a key support and reached its lowest level since March 2021. But the main US index rebounded at the end of the day to close the session unchanged. This rebound was followed by the best weekly gain since November 2020, helping the S&P 500 to end the month in positive territory, albeit very slightly. The MSCI World also posted a modest weekly gain (+0.2%). The performance spread between countries is quite tight over the period. Japan’s Topix gained +0.8% while the MSCI Europe ex UK fell -0.6%.
Source: JP Morgan
Story #6 —
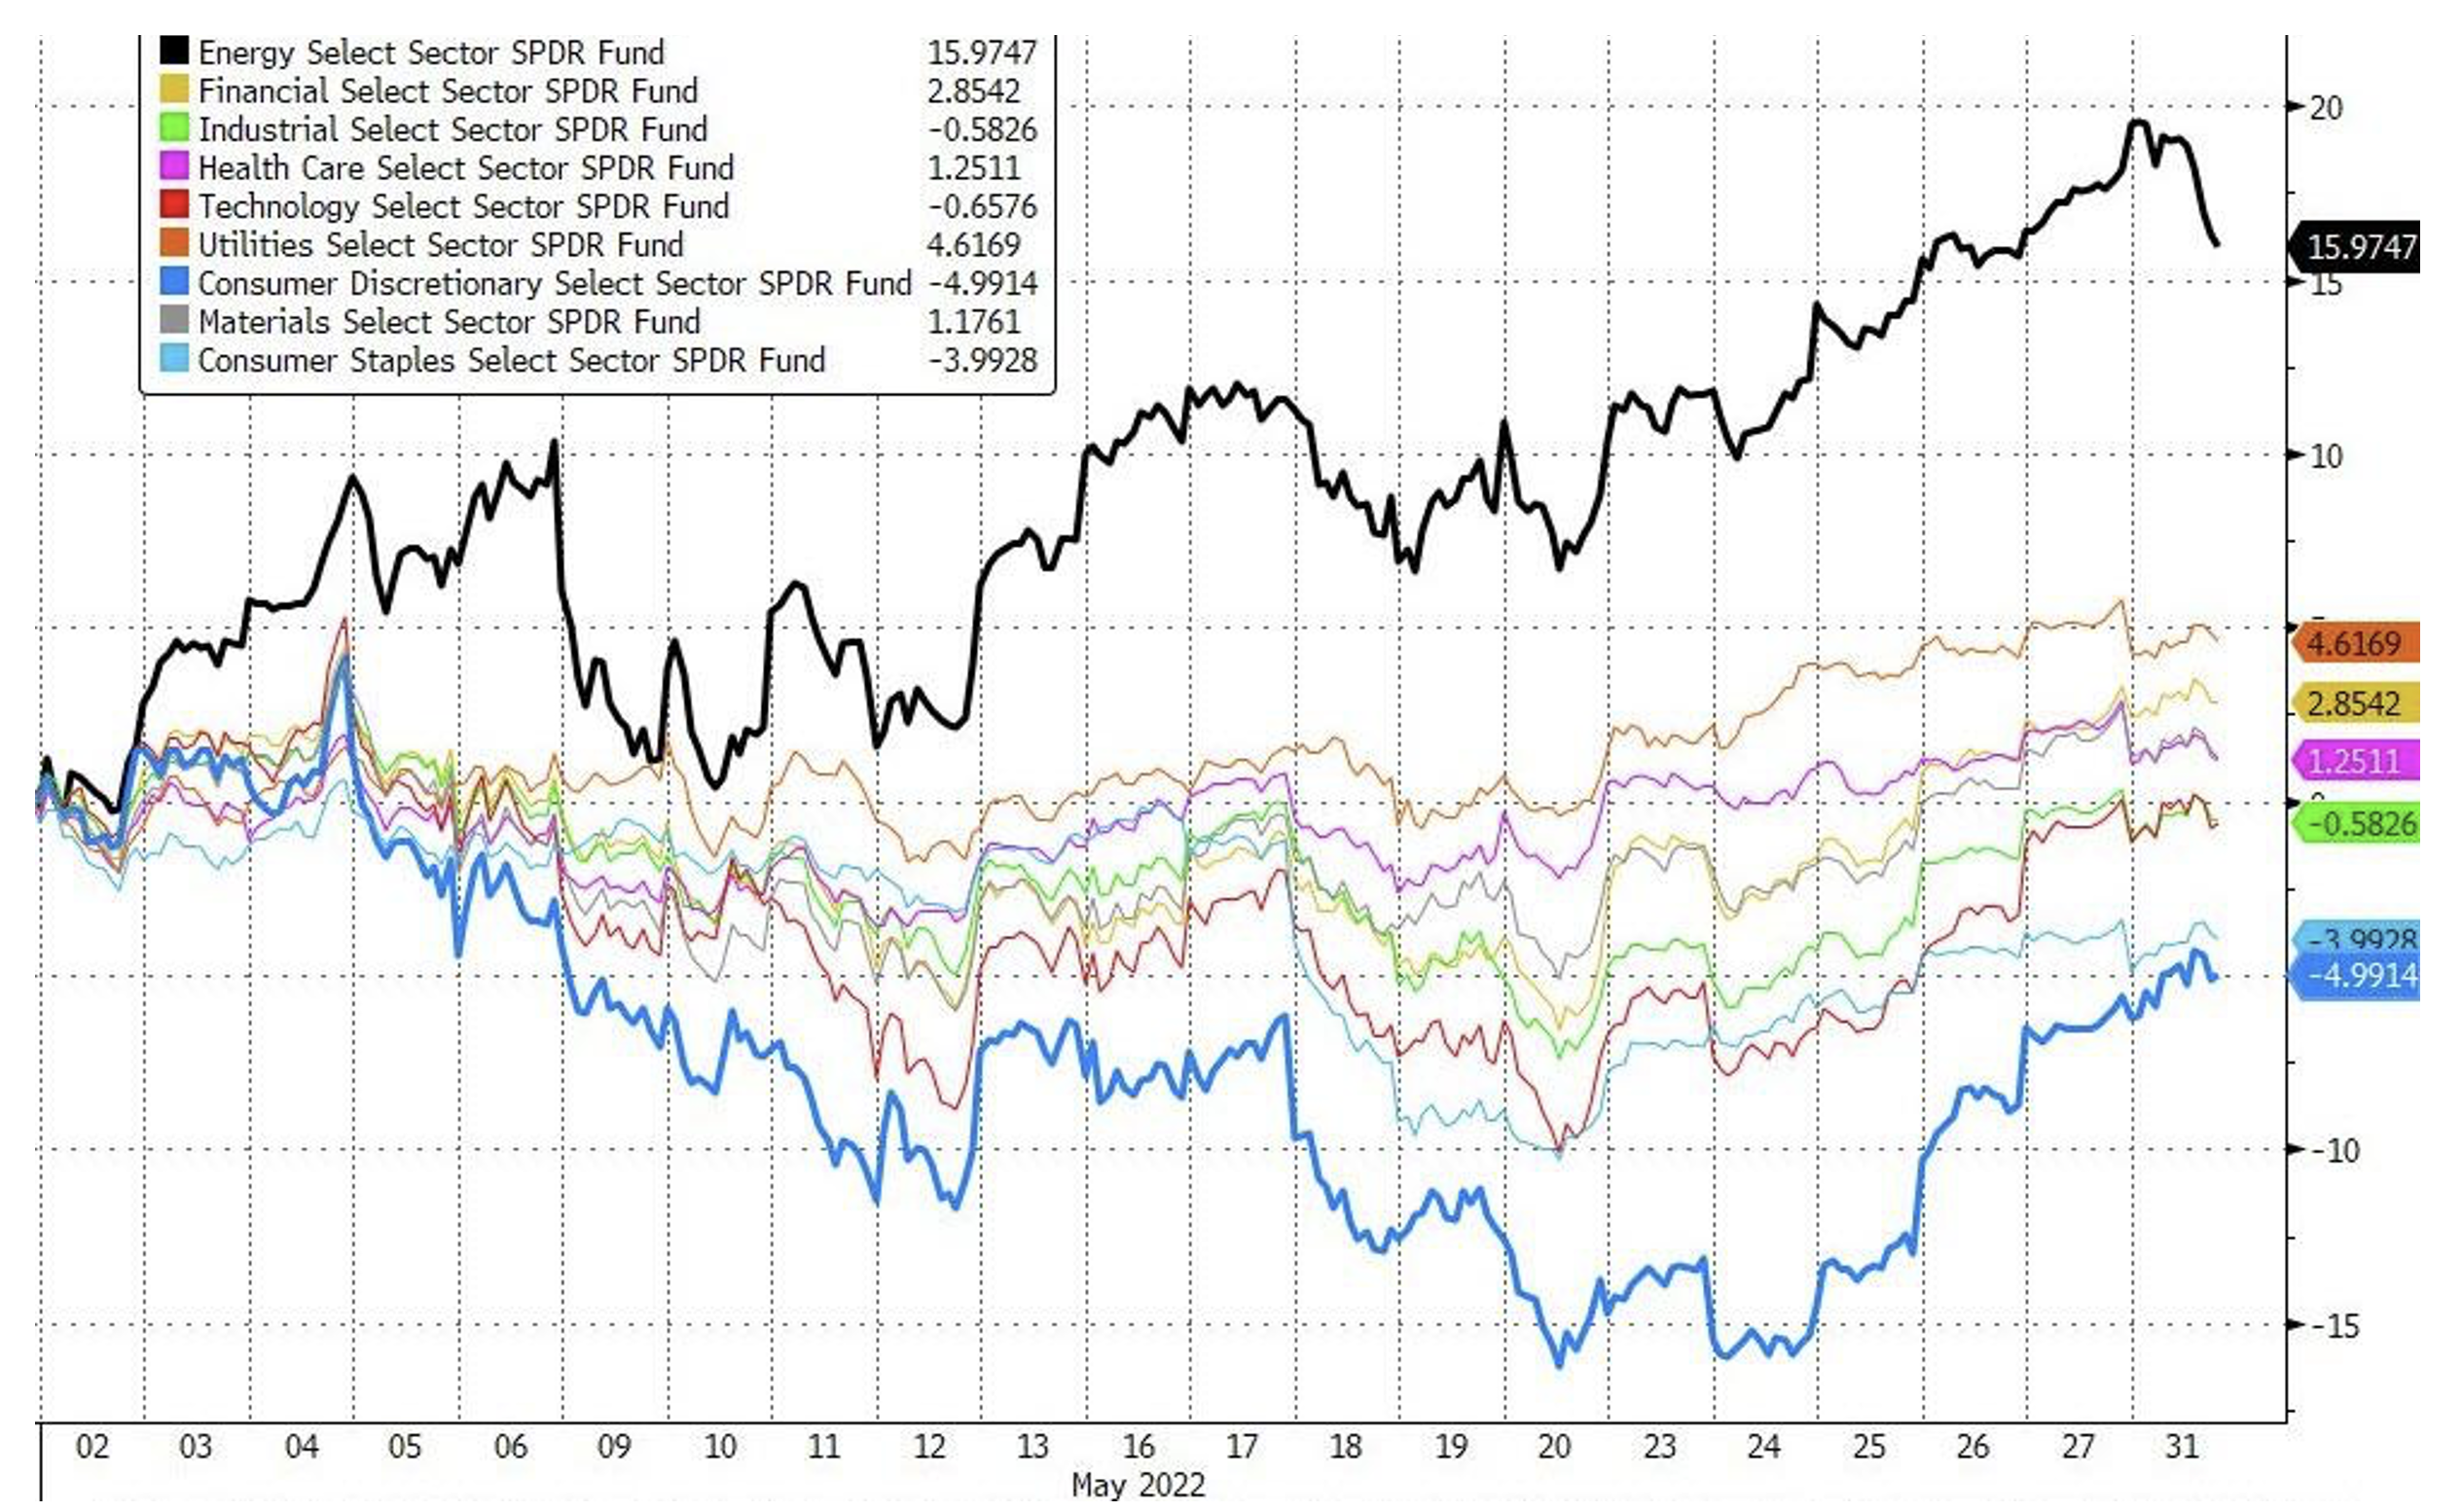
Value style continues to lead
From a style perspective, Global Value (+2%) outperformed Growth (-2.2%) over the month. Since the start of the year, Value is outperforming Growth by 19%. Looking at S&P 500 sector performance, energy was by far the best performing sector (+16%). Utilities came in 2nd best (+4.6%) while Technology recorded another negative monthly performance (-0.7%). Consumer Discretionary (-5%) and Consumer Staples (-4%) were the two worst performing sectors.
Source: Bloomberg
Story #7 —
Equities and bond yields are finally diverging
Fixed Income also recorded positive returns in May with the Global Aggregate US Bond index posting a 0.6% gain. However, Euro Government bonds (-1.8%) and Euro High Yield (1.3%) ended in the red. Indeed, the US 10-year bond yield peaked at around 3.2% early in the month before declining to 2.8% as inflation expectations came down. While bond yields and equity markets have moved in tandem in recent months, the recent divergence between bond and equity markets could signal a return to a more normal relationship between the two asset classes.
Story #8 —
Commodities up almost 33% since the start of the year
A global commodity index was up 1.5% in May as oil and soft commodity prices continue to climb. Since the start of the year, commodities are by far the best performing asset class with a 32.7% gain. Industrial metals retreated in May as Covid lockdowns in China led to a major slowdown in manufacturing activity which could ultimately weigh on industrial metal imports. Meanwhile, the WTI Oil (US index) is currently testing an important resistance level ($115 per barrel) as the crude reserves in the US have fallen to their lowest levels since September 1987. As shown on the chart below, the cumulated US Big 4 storage is collapsing.
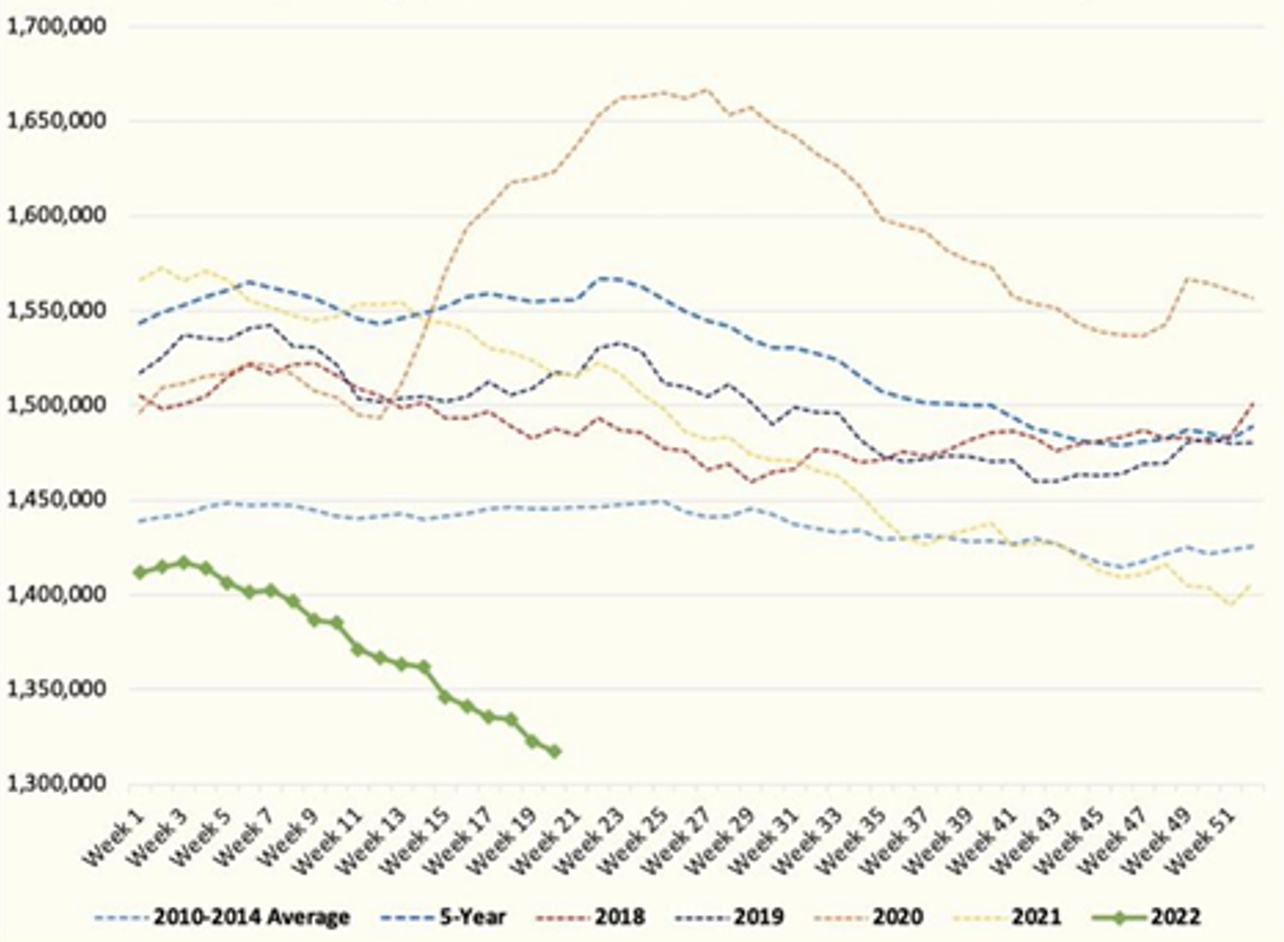
Source: EIA, HFIR
Story #9 —
A down month for the dollar index
May saw the dollar index suffer its worst month since May 2021, marking a pause in the very strong run which has been in place over the last 12 months. The euro was up 1.5% over the month and the yen up 0.7%. Nevertheless, we note that the euro remains in a long-term downward trend against the dollar. Indeed, while the economic surprises index in the Eurozone has been doing much better than in the US (see yellow line on the chart below), the euro (purple line) has been consistently losing ground against the dollar over the last few months.
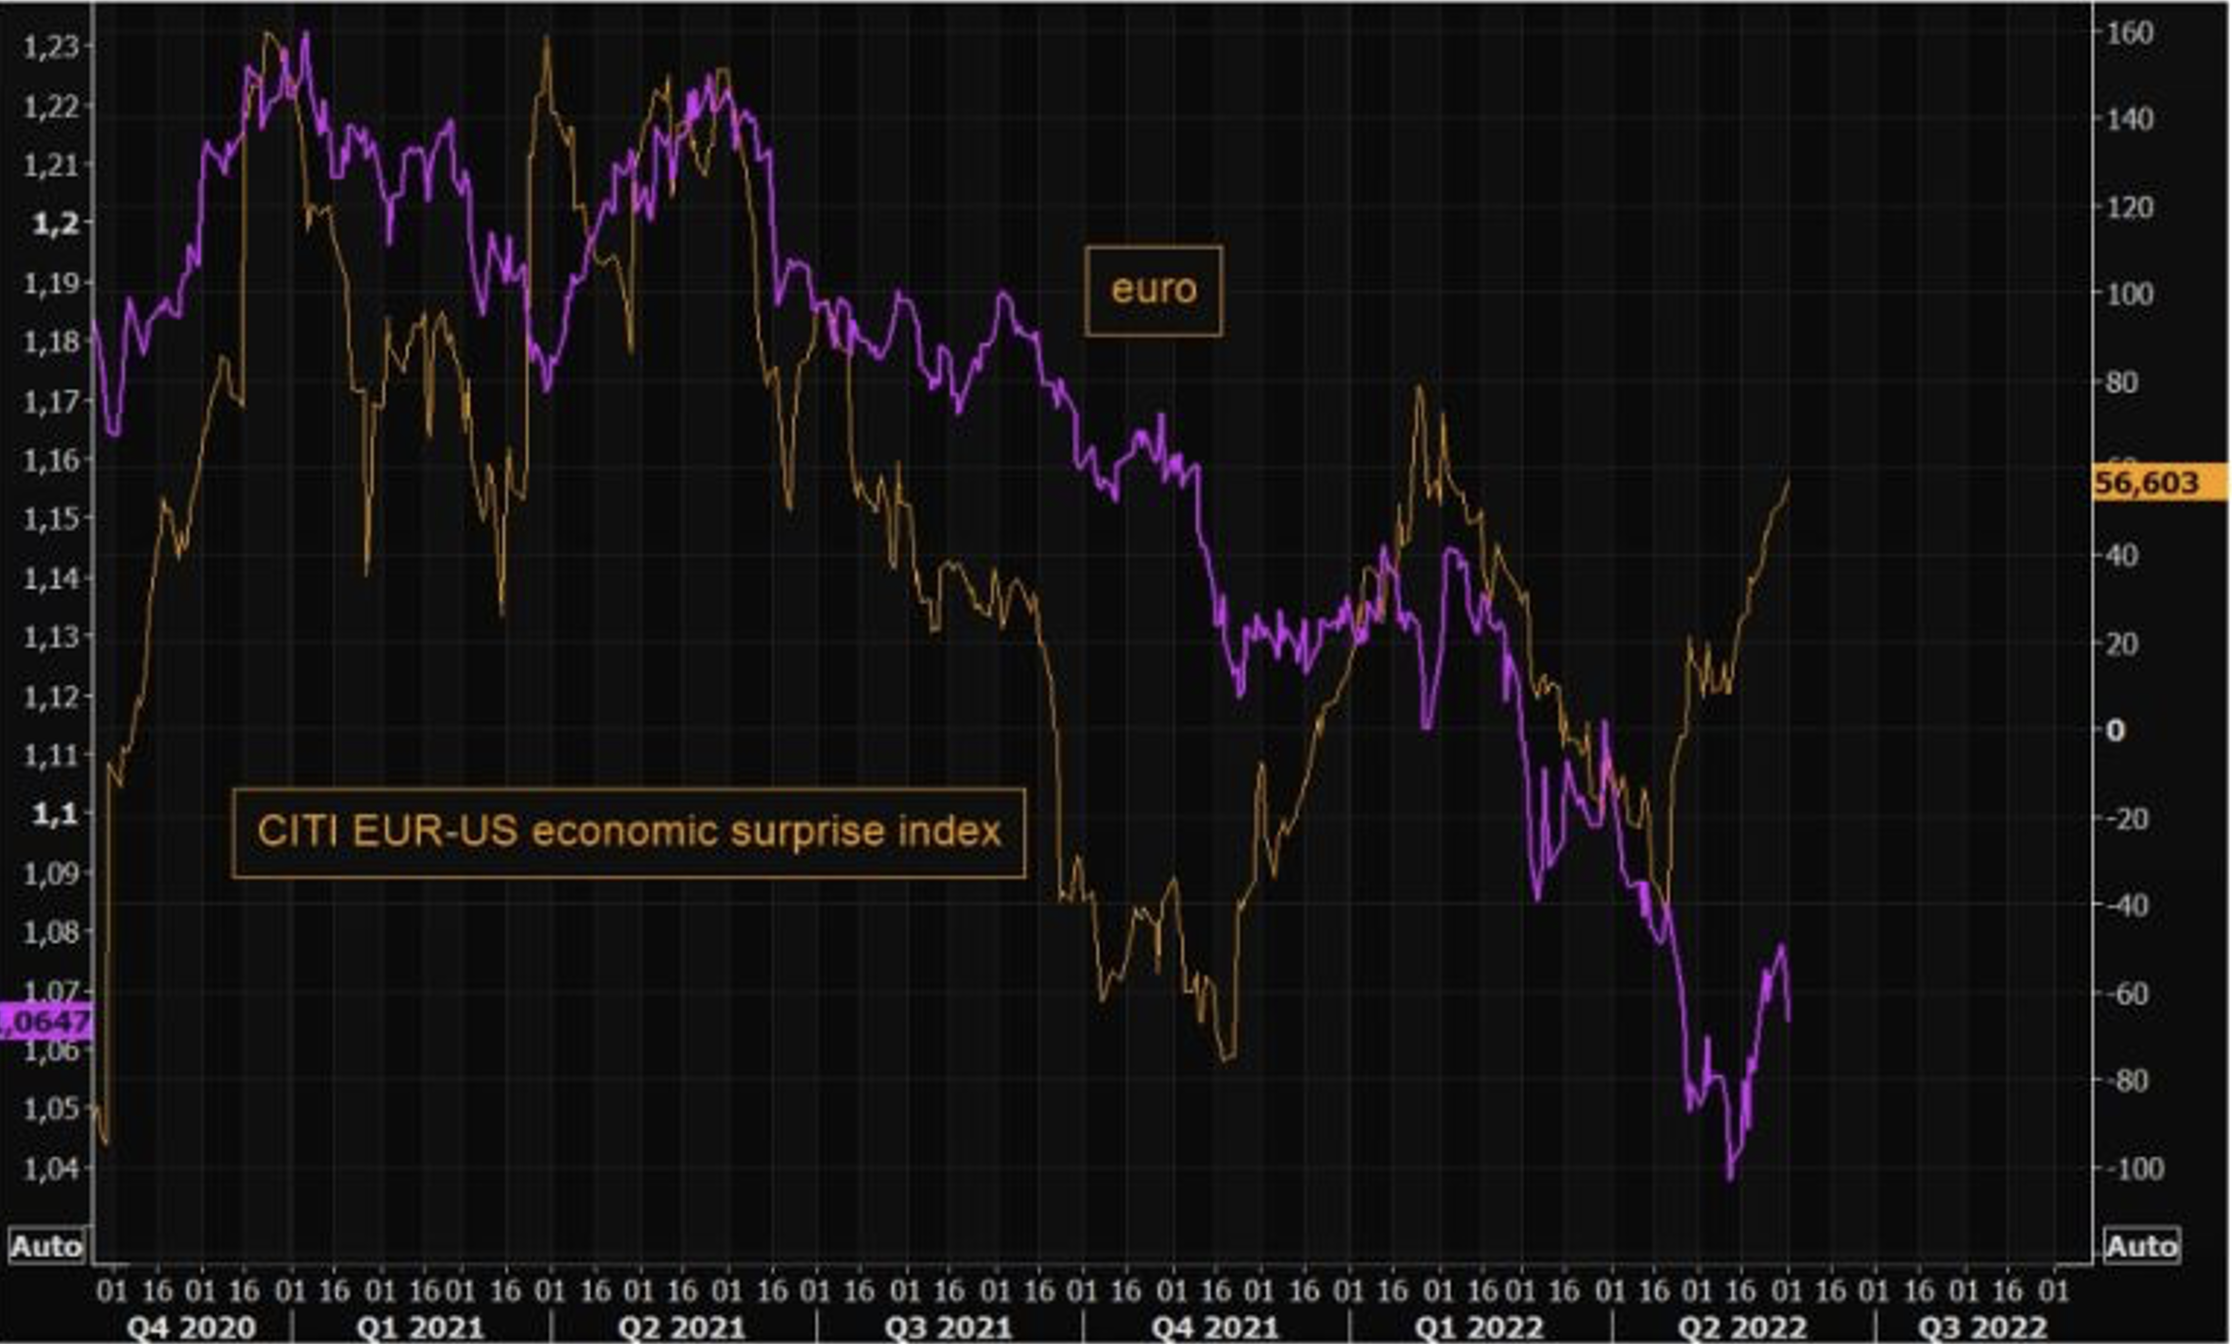
Source: JP Morgan
Story #10 —
TerraUSD stablecoin crypto crash
The general move of asset liquidation, which has been in place since November 2021, is affecting the most speculative segments of the market even more. Cryptocurrencies have already suffered a dramatic decline before the start of last week. The downward movement was further accelerated by the fall of the TerraUSD (UST) "stablecoin". Stablecoins play a very important role in the cryptocurrency ecosystem. In principle, they allow cryptocurrency investors to "park" their assets in digital assets that replicate the evolution of "fiat" currencies, i.e. the dollar, the euro, etc. These stablecoins are therefore supposed to be stable because they are backed by "traditional" currencies. The sudden de-anchoring of the TerraUSD mid-May sent shockwaves through the crypto world. The TerraUSD de-pegging threw all stablecoins into turmoil, including Tether, which accounts for almost half of the capitalisation of this segment. For now, Tether's peg seems to be holding. In fact, it is the stablecoins that are based on algorithms (such as TerraUSD) that have crashed while those based on physical reserves (Tether, USDC, etc.) are holding up - at least for now. However, these spectacular dips have cast a pall over the whole crypto universe. Bitcoin is now down over 60% from its all-time high in October 2021. The market capitalisation of all cryptos has suffered a decline of $1.7 trillion from its highs.
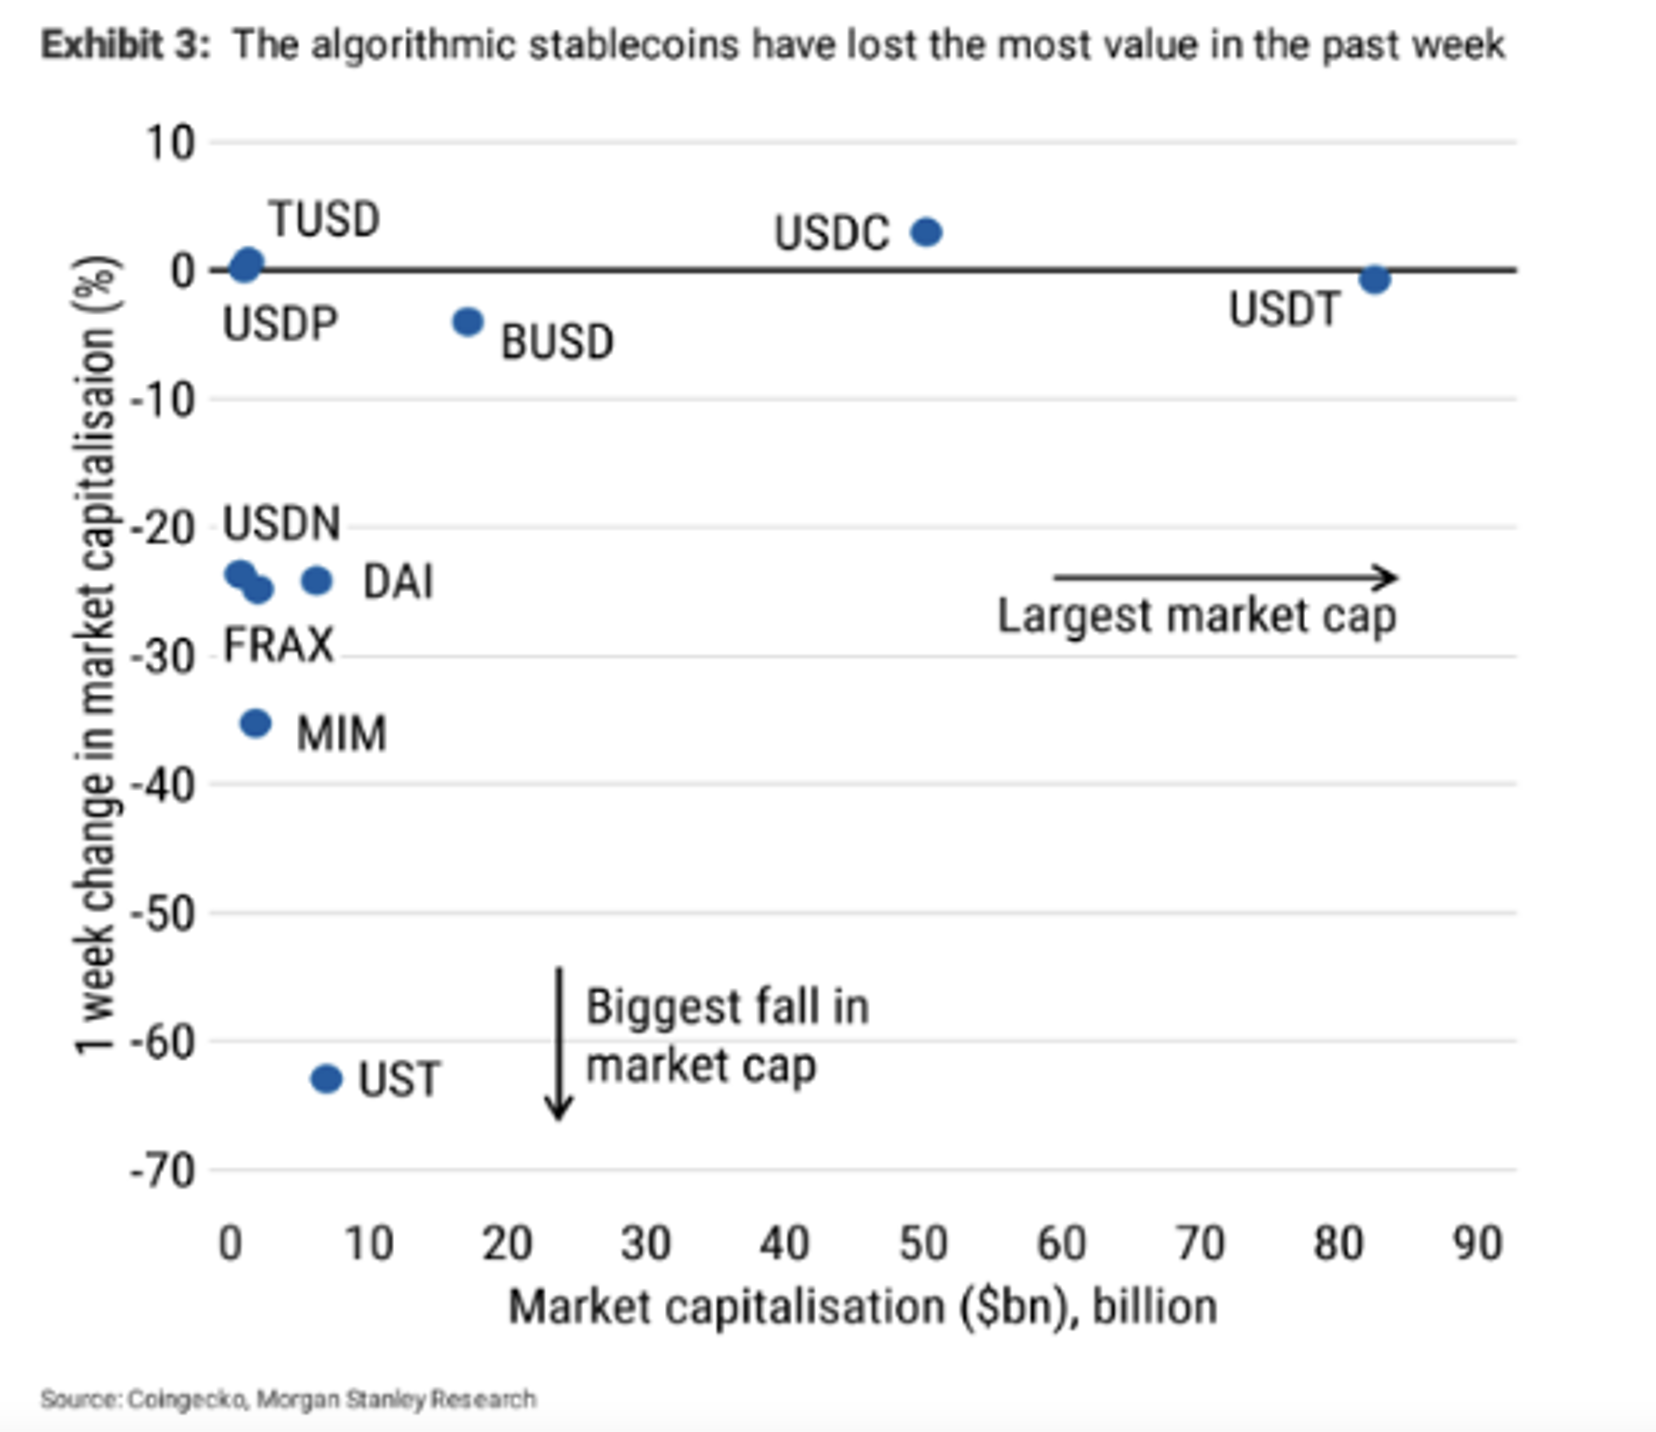
Source: Coingecko, Morgan Stanley Research