U.S. retail sales surprised on the upside, hitting a new all- time high in July, up 3.6% over the past six months. The picture is very different if one adjusts these numbers with the inflation rate taken into account. Indeed, real retail sales peaked in April 2021 and are down 1.1% over the past six months.
Chart #1 — US retail sales in nominal vs. real terms
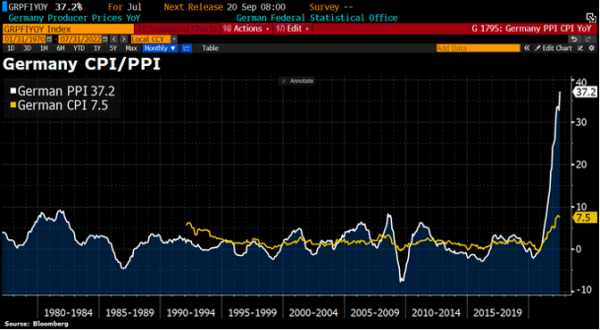
Chart #2 — Producer price index soars in Germany
Is the peak of inflation behind us? Clearly not in Europe! German producer prices rose by 37.2% (month-on-month) in July, a new record. This suggests that the consumer price index has probably not reached its peak and that Germany could suffer the same fate as the UK, i.e. double-digit inflation.
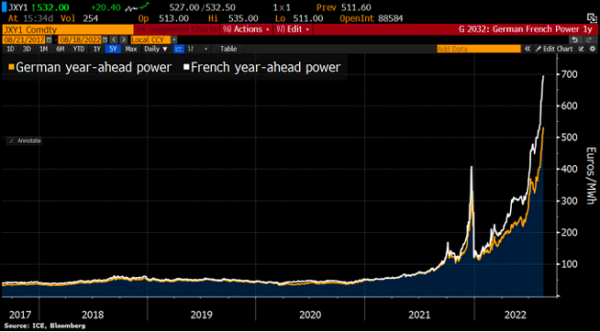
Chart #3 — European electricity prices continue to break new records
Electricity prices in Germany and France continue to rise and reach new records. The one-year electricity contract in Germany has exceeded €500/MWh for the first time in its history. The price of electricity in France for the next year is trading at around €700/MWh... Unless there are significant subsidies, this increase in electricity prices will weigh heavily on the purchasing power and margins of European companies.
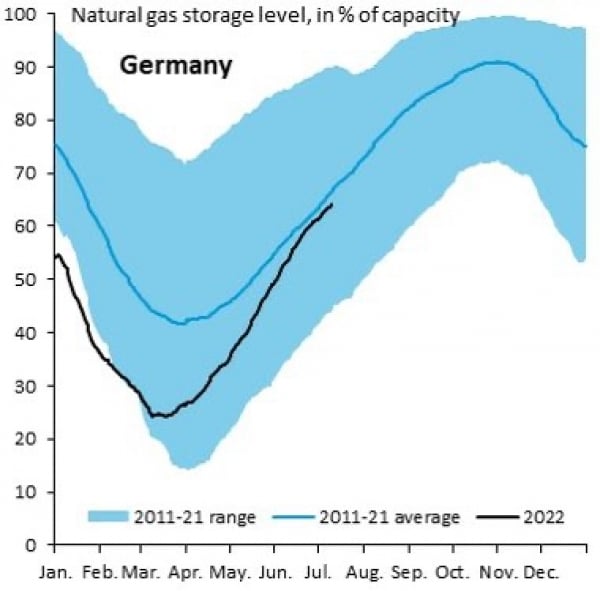
Chart #4 — The level of gas reserves in Germany is a misleading figure
Gas storage levels in Germany usually reach 90% by late autumn; this is the level required for Germany to get through the winter. But this assumption is valid if, and only if, the Nordstream pipeline - which transports imported gas from Russia - is fully operational. But the famous pipeline is currently only operating at 20% of its total capacity. As a result, even with storage levels close to 90 or 95 percent in the coming months, Germany will probably not have enough gas this winter. If Russia reduces supplies, the current storage level will not be able to cover 3 months’ worth of gas needs. Gas rationing this winter is a strong probability.
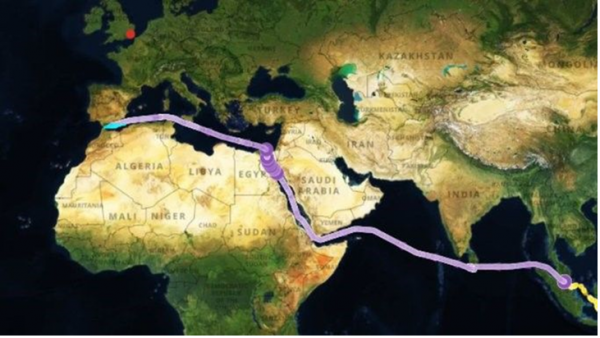
Chart #5 — Liquefied natural gas imported from... Australia
Europe is so desperate for natural gas that it is importing a shipment of liquefied natural gas from Australia (!). This Australian gas has been recharged in Malaysia and will now be shipped to the UK. According to Bloomberg data going back to 2016, Australia has never shipped Liquefied Natural Gas to Europe.
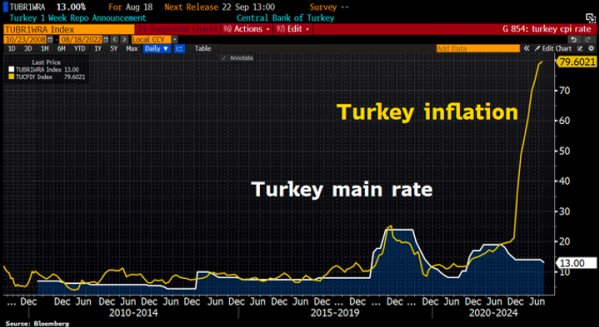
Chart #6 — Turkish National Bank surprises the markets again
Turkey is pursuing an unorthodox monetary policy. Despite inflation being at its highest level in 24 years and the Turkish lira near its lowest levels, it has just decided on an abrupt interest rate cut. The use of monetary stimulus less than a year before the elections reflects the determination of the Turkish authorities to keep Erdogan's promise of further rate cuts, prioritizing growth over price controls.
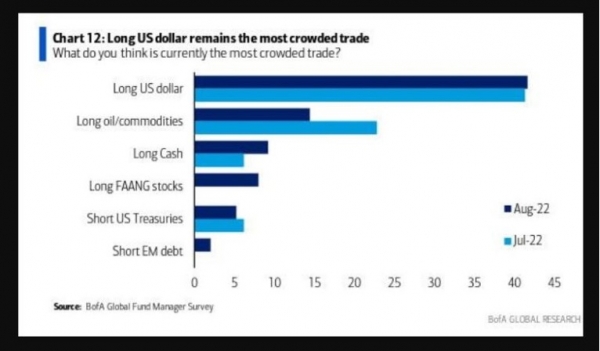
Chart #7 — The dollar is the asset perceived by fund managers as being the most crowded trade
Members of the Federal Reserve have been sending the dollar soaring in the past week with their media appearances. Their message is pretty clear: peak inflation may not be behind us, and the Fed will continue to raise rates. The Bloomberg Dollar Index was up 2% on the week, its biggest weekly gain since April 2020.
An opinion survey of fund managers conducted by BofA on a monthly basis (July in this case) shows that the long US dollar position is currently perceived as the most consensual ("crowded trade"). This is followed by commodities and cash.
Disclaimer
This marketing document has been issued by Bank Syz Ltd. It is not intended for distribution to, publication, provision or use by individuals or legal entities that are citizens of or reside in a state, country or jurisdiction in which applicable laws and regulations prohibit its distribution, publication, provision or use. It is not directed to any person or entity to whom it would be illegal to send such marketing material. This document is intended for informational purposes only and should not be construed as an offer, solicitation or recommendation for the subscription, purchase, sale or safekeeping of any security or financial instrument or for the engagement in any other transaction, as the provision of any investment advice or service, or as a contractual document. Nothing in this document constitutes an investment, legal, tax or accounting advice or a representation that any investment or strategy is suitable or appropriate for an investor's particular and individual circumstances, nor does it constitute a personalized investment advice for any investor. This document reflects the information, opinions and comments of Bank Syz Ltd. as of the date of its publication, which are subject to change without notice. The opinions and comments of the authors in this document reflect their current views and may not coincide with those of other Syz Group entities or third parties, which may have reached different conclusions. The market valuations, terms and calculations contained herein are estimates only. The information provided comes from sources deemed reliable, but Bank Syz Ltd. does not guarantee its completeness, accuracy, reliability and actuality. Past performance gives no indication of nor guarantees current or future results. Bank Syz Ltd. accepts no liability for any loss arising from the use of this document.
Related Articles
Oracle bets on OpenAI and Santa continuously delivers S&P 500 gains during the holidays. Each week, the Syz investment team takes you through the last seven days in seven charts.
Inflation remains Americans’ top concern while Swiss inflation hit zero. Each week, the Syz investment team takes you through the last seven days in seven charts.
Meanwhile, Big Tech carries the S&P 500. Each week, the Syz investment team takes you through the last seven days in seven charts.


.png)

