

.png)
US equities rose strongly last week on the back of political changes in the UK, reassuring earnings reports and indications that the Fed may be moderating the pace of its interest rate hikes. The S&P 500 recorded its best weekly gain in nearly four months, (+4.7%), while the Dow Jones had its third consecutive week of gains. As the chart below shows, active fund managers seem to be slightly increasing their allocations to equity markets, anticipating a seasonal rally.
Chart #1
Investors are gradually returning to the equity markets
Portfolio managers increased their equity allocations after their aggregate exposure hit a two-year low
Source: Bloomberg
Chart #2
A record week for UK Gilts
UK sovereign bonds have been at the centre of market turmoil since the beginning of the month. They have just had their best week ever. The main triggers were a new finance minister on Monday and the resignation of Prime Minister Elizabeth Truss on Thursday.
It is still unclear what the new fiscal programme will be, but the markets have welcomed both changes in the UK executive. With Boris Johnson out of the race since Sunday night, Rishi Sunak (former chancellor) will probably be the new PM,
Record low yields on 30-year UK bonds and 10-year inflation-linked bonds
Source: Bloomberg
Chart #3
A rush on S&P 500 call options
In recent months, many investors have positioned their portfolios (too?) defensively or even net short. As a result, any rise in the market forces many investment funds to buy equities in order to hedge. To do so, they rush to buy call bonds whose price (measured by implied volatility) has rarely been very high compared to put bonds. As the chart below shows, the "skew" (i.e. the difference between the premium of out-of-the-money puts and out-of-the-money calls that are separated by the same distance from the price of the underlying) is close to record levels.
The difference between the implied volatility of call options and put options (on the S&P 500) is very large, resulting in a record skew
Source: Bloomberg
Chart #4
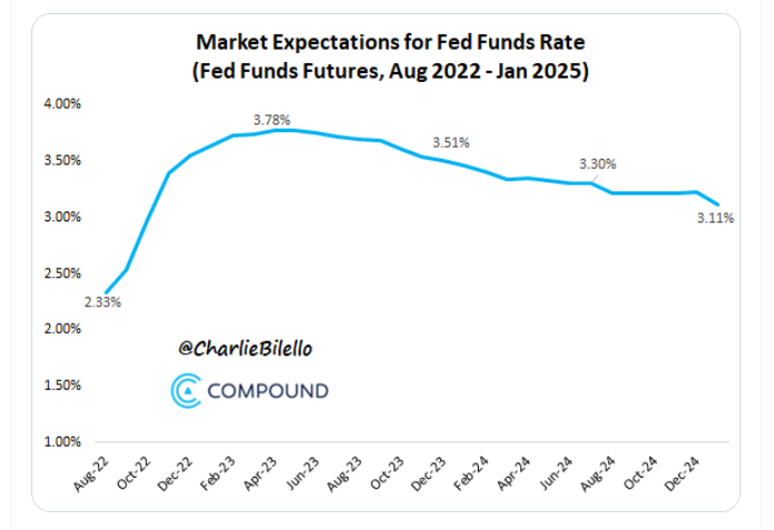
Slight downward revision to expected Fed rate hikes
Several Fed members suggested on Friday that there could be a lull in the rate hike next year. This would not be a "pivot" (i.e. a change in the Fed's monetary policy direction) but rather a pause in the monetary tightening movement.
The market has slightly adjusted downwards the level of the Fed's terminal rate, i.e. the rate at which monetary tightening is expected to peak. A 75 basis point hike at the November meeting remains a near certainty for the market. However, the probability of a 75 basis point hike at the December meeting has fallen from 70% to 30%. Similarly, the probability of a 50 basis point increase in February 2023 has dropped from 50% to 30%.
Market expectations for future Fed rate hikes
Source: Bloomberg
Chart #5
Japan intervenes in the foreign exchange market
In recent months, causal links have been established between several asset classes: the fall in the yen has led to forced sales of US Treasury bonds (by Japanese entities in urgent need of dollars). The rise in US bond yields, in turn, weighed on the valuation of risky assets - including equities.
On Thursday, a dollar could buy you JPY 153, a new low that most certainly prompted the Bank of Japan to intervene in the foreign exchange market. This intervention did not go unnoticed as the yen gained no less than 6 figures on the day.
The yen's rise had a positive impact on US bonds (lower yields) and contributed to the rise in US stocks
Yen against dollar over the last week
Source: Bloomberg
Chart #6
A Fed "pivot" does not guarantee a market rally
While a Fed pivot is considered by many investors to be a necessary and sufficient condition for an equity rally, this has not always been the case in recent history.
The table below shows that, on the contrary, the Fed's emergency course changes have often led to a further decline.
Indeed, pivots have most often taken place during periods of financial market dislocation, marked by forced liquidations and panic selling. On average, there was a 14-month gap between the Fed's pivot and the market lows.
Buying stocks in anticipation of a pivot is therefore risky - even if the pivot actually occurs.
Historically, a Fed pivot has triggered an accelerated decline in equity markets
Source: FT
Chart #7
US stocks are not that cheap
The S&P 500 index cannot be considered undervalued, despite the sharp decline from the November 2021 highs. Indeed, the S&P 500 is paying more than 15 times expected earnings for 2023. As a reminder, the same multiple was less than 10 in the 1970s, the last decade with a very high inflation rate.
On an absolute & relative basis, US stocks look expensive
Source:Factset, Goldman Sachs