Charles-Henry Monchau

Chief Investment Officer

 
Chart #1

Jackson Hole, when the hawks meet


As it does every year, the Federal Reserve Bank of Kansas City hosted the annual Economic Policy Symposium in Jackson Hole, where dozens of central bankers, policymakers, academics and economists gather.

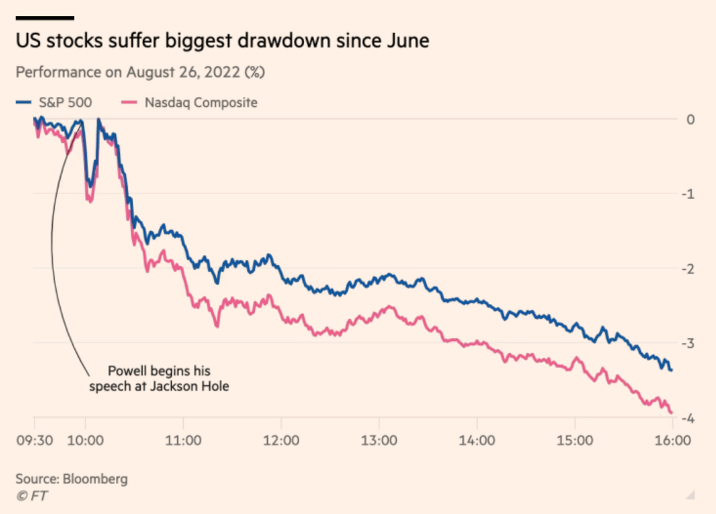
Many economists expected a non-event. The latest inflation numbers suggested a fairly balanced message from Fed Chairman Jay Powell. However, his speech was interpreted as that of a hawk, i.e., resolutely oriented towards a longer and more important monetary tightening than the market had hoped for.

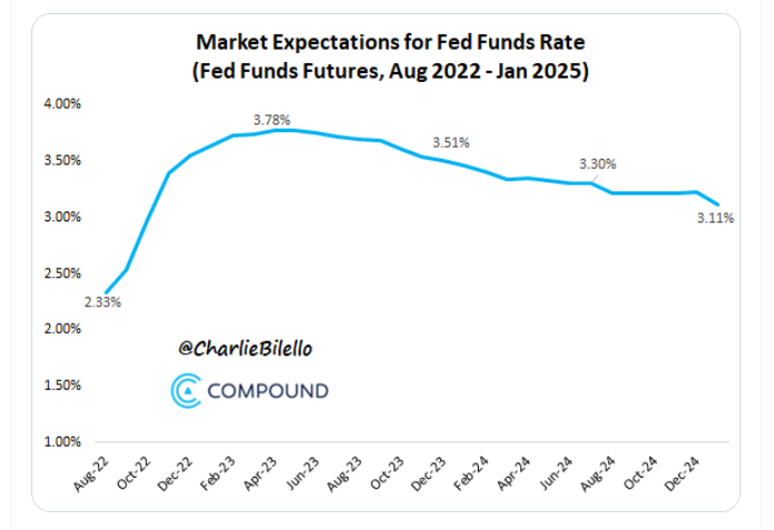
There is indeed a dichotomy between the Fed's projections and those of the market. For its part, the Fed intends to raise rates for a relatively long period of time with no intention of lowering them anytime soon. The markets, for their part, were expecting rate hikes in the very short term, which will give way to rate cuts as early as 2023. At this Symposium, it seems that Mr. Powell's intention was to convince investors that the rate cuts in 2023 currently expected by the market are too optimistic.

The market adjustment was almost instantaneous. On Friday, just after Mr. Powell's speech, the yield curve indicated that investors now expect the Fed to raise interest rates to 3.8% by February 2023, up from expectations of 3.3% at the beginning of the month. In terms of sequencing, markets now assign a high probability to the following scenario: 75 basis point hike in September 2022, 25 basis point hike in November 2022, December 2022 and February 2023. The first rate cut would not occur until late 2023 or even early 2024.


Market expectations for the future direction of interest rates
Source: Charlie Bilello
 
Chart #2

Mr. Powell's speech did not please the financial markets


The priority given to fighting inflation at the expense of growth was clearly outlined during Powell's speech.

Indeed, the Fed Chairman also issued a very clear warning to the American public: prepare for hard times. For Mr.Powell, reducing inflationary pressures will likely require an extended period of below-trend growth with a deteriorating labor market. Even though much of the inflation is supply driven, it is the Fed's job to lower demand to restore price balance, he said.

Tight monetary policy at the expense of growth is a formula that investors are not happy with. Since the release of July's inflation figures, markets had begun to anticipate the Fed's famous "pivot", i.e. a forthcoming shift in monetary policy, which had led to a rally in risky assets. Jackson Hole destroyed these hopes and the impact on the markets was immediate - the bears are back!

U.S. stocks fell sharply after Powell's speech. The S&P 500 Index fell 3.4%, while the Nasdaq Composite, dominated by technology stocks, which are more sensitive to interest rate expectations, lost 3.9%. It was the biggest daily decline for both indexes since mid-June.

Friday's drop in U.S. stocks was particularly broad-based, with about 99% of S&P 500 companies down on the day. Investors are concerned that higher interest rates and a continued economic slowdown will weigh on corporate earnings later this year.


U.S. stocks fell sharply after Mr. Powell's speech

U.S. stocks fell sharply after Mr. Powell's speech
Source: FT


Chart #3

The come-back of volatility?


Friday's session was also marked by the return of volatility. Indeed, the VIX index ("the fear index") reacted disproportionately. In other words, the VIX rose more than the S&P 500 fell, a dichotomy that has not been seen in recent months. As a reminder, the seasonality of the VIX over the past 20 years shows an upward trend in September/October.


Inverted VIX (in purple) and S&P 500 (in orange)

Inverted VIX (in purple) and S&P 500 (in orange)

Source: TME


Chart #4

Energy stocks are outperforming again


Energy was the only sector to finish the week in the green (+4%), while the technology and consumer discretionary sectors lost more than 4%. A performance gap that could be justified by fundamentals: the consumer discretionary sector is now worth 2.6 times the size of the energy sector, while the latter generates more than 5 times the free cash flow.


Enterprise value and free cash flow for S&P 500 energy and consumer cyclical stocks

Enterprise value and free cash flow for S&P 500 energy and consumer cyclical stocks
Source: Bloomberg, Crescat Capital
 
Chart #5

Peak inflation in the Eurozone might be far away from us


Eurozone government bond yields rose last week. In particular, the market reacted to a Reuters article, which mentioned that some ECB policymakers intend to discuss a 75 basis point interest rate hike at the September meeting, despite the fact that the risk of recession is increasing.

We also note that the market believes that peak inflation in the Eurozone will occur much later than expected in the US.

In addition, it is expected to remain high for a longer period of time for at least 3 reasons:

  1. The surge in electricity prices;
  2. The weakness of the euro;
  3. A future easing of government price-cap measures (currently, Eurozone inflation is kept artificially lower than the level that should prevail).


Difference between market expectations for European and U.S. one-year inflation

Difference between market expectations for European and U.S. one-year inflation
Source: Bloomberg, Christophe Barraud
 
 
Chart #6

Italian bonds, the new "big short"?


Hedge funds are betting against Italy. Aggregate positions show that hedge funds have built up their largest short positions against Italian debt since 2008.


Hedge funds have been increasing their short positions on Italian debt

Hedge funds have been increasing their short positions on Italian debt
Source: FT
 
Chart #7

Europe continues to sink into an unprecedented energy crisis


Europe continues to sink into an unprecedented energy crisis. The price of French electricity for 1 year exceeds the 1,000 € per megawatt hour for the first time ever. The German equivalent has also reached a record high, reaching up to €829 per megawatt hour, a 48% increase in one week! Of course, these are prices of futures contracts, used as a hedging instrument and traded on a market with little liquidity. We should therefore not assume that users will see their bills increase by an equivalent percentage.

Moreover, many countries (France, Greece, etc.) are ready to put in place accompanying measures, especially for the less well-off households. But it is clear that Europe will have to face a very complicated winter, and that the old continent is losing its competitiveness to the United States and Asia. Deindustrialization is accelerating with the closure of factories in many European countries.


One-year ahead power futures in France and Germany

One-year ahead power futures in France and Germany
Source: Bloomberg
 

Disclaimer

This marketing document has been issued by Bank Syz Ltd. It is not intended for distribution to, publication, provision or use by individuals or legal entities that are citizens of or reside in a state, country or jurisdiction in which applicable laws and regulations prohibit its distribution, publication, provision or use. It is not directed to any person or entity to whom it would be illegal to send such marketing material. This document is intended for informational purposes only and should not be construed as an offer, solicitation or recommendation for the subscription, purchase, sale or safekeeping of any security or financial instrument or for the engagement in any other transaction, as the provision of any investment advice or service, or as a contractual document. Nothing in this document constitutes an investment, legal, tax or accounting advice or a representation that any investment or strategy is suitable or appropriate for an investor's particular and individual circumstances, nor does it constitute a personalized investment advice for any investor. This document reflects the information, opinions and comments of Bank Syz Ltd. as of the date of its publication, which are subject to change without notice. The opinions and comments of the authors in this document reflect their current views and may not coincide with those of other Syz Group entities or third parties, which may have reached different conclusions. The market valuations, terms and calculations contained herein are estimates only. The information provided comes from sources deemed reliable, but Bank Syz Ltd. does not guarantee its completeness, accuracy, reliability and actuality. Past performance gives no indication of nor guarantees current or future results. Bank Syz Ltd. accepts no liability for any loss arising from the use of this document.

Read More

Straight from the Desk

Syz the moment

Live feeds, charts, breaking stories, all day long.

Thinking out loud

Sign up for our weekly email highlighting the most popular posts.

Follow us

Thinking out loud

Investing with intelligence

Our latest research, commentary and market outlooks