Charles-Henry Monchau

Chief Investment Officer


Chart #1 - A big week for central banks

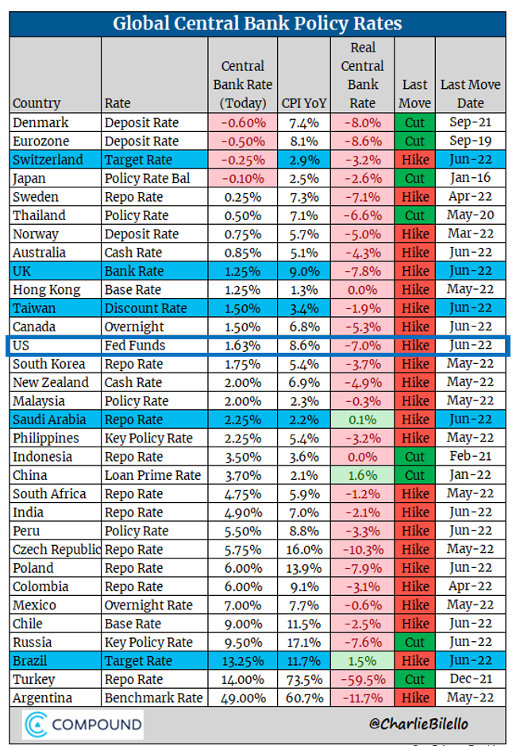
As expected, the U.S. Federal Reserve raised policy rates by 75 basis points, which is its most aggressive move since 1994. But the Fed was not the only central bank to take center stage last week. Of course, monetary authorities in countries whose currencies are pegged to the dollar raised their rates in the process (e.g. Saudi Arabia). But the most unexpected move came from the Swiss National Bank, which raised rates by 50 basis points, its first rate hike since 2007. The Bank of England also made an upward adjustment of 25 basis points. At the same time, the European Central Bank held an unscheduled meeting and indicated that it would take action to stem the widening of yield spreads between member states' sovereign bonds. Elsewhere in the world, Brazil raised its policy rate by 50 basis points and Taiwan by 12.5 basis points. The only central bank to remain inactive was the Bank of Japan, which, despite inflationary pressures, decided to maintain its negative rate policy and the use of yield curve controls to suppress any rise in long-term yields. As the chart below shows, the rate hike is global, but there are still large disparities in real rates.


Global central bank policy rates

Global central bank policy rates
Source: Charlie Bilello
 

Chart #2 - Will the SNB start to sell US stocks?

The Swiss National Bank unexpectedly raised rates by 50 basis points to curb inflation, seizing a window of opportunity to move closer to positive rates. Not only did the SNB raise the key interest rate, but it also warned that  it might sell some of the securities on its balance sheet. Indeed, the SNB has diversified its foreign exchange reserves into equities and corporate bonds over the years and this trend may soon be reversed. The goal is to sell U.S. stocks and use the dollars to buy Swiss francs, making the Swiss currency stronger and thus fighting inflation.

The SNB currently holds about $177 billion in U.S. equities, concentrated mainly in large technology stocks. Indeed, the SNB is one of the largest holders of Apple, Microsoft and Amazon shares in the world. Will we see more selling pressure on the Nasdaq?


Will the SNB start to sell US stocks?
Source: Bloomberg
 

Chart #3 - The Dow Jones ends in the red again

The Fed's monetary tightening is sparking recession fears and sent stocks tumbling for a second straight week. The S&P 500 Index posted its worst weekly decline since March 2020 and entered a bear market, ending the week nearly 24% below its January peak. As for the Dow Jones Industrial Average, it has recorded 11 weeks of declines out of the last 12, a streak that has never been seen before. While U.S. stocks rallied after the FOMC decision on Wednesday, the mood on Wall Street deteriorated on Thursday due to weak macroeconomic numbers. Indeed, several reports (housing starts, building permits) indicated that the U.S. housing sector was already feeling the impact of the Fed's tightening and the surge in mortgage rates. In addition, U.S. retail sales were lower than expected, while weekly jobless claims were higher than expected.


The Dow Jones ends in the red again
Source: Bloomberg
 

Chart #4 - Times remain very difficult for multi- asset investing

Stocks were not the only asset class to suffer over the past week. Inflation and interest rate fears pushed the 10-year U.S. Treasury yield to 3.49% on Tuesday (its highest level in more than a decade) before falling back to 3.24% by the end of the week. Most fixed income segments were down for the week.

After some divergence, the return to a simultaneous decline in stocks and bonds makes multi-management very complicated. Indeed, the positive correlation between the two asset classes cancels the traditionally beneficial effects of diversification. A 60/40 (stock/bond) U.S. index is down nearly 20% from its historical highs, with the magnitude of the decline almost equally divided between stocks and bonds.


Times remain very difficult for multi- asset investing
Source: Bloomberg
 

Chart #5 - «Smart money» is buying US stocks during the downturn

Several indicators suggest that U.S. stocks are very clearly in oversold territory. Another indicator worth noting is that Bloomberg's SMART Money Flow has soared as part of this pullback in stocks, creating a de facto positive divergence. The Smart Money Flow index is calculated using a formula that measures Dow Jones stock during two periods: shortly after the open and in the last hour. The first few minutes represent emotional, greed and fear-driven buying by retail investors based on good and/or bad news. The last hour is often dominated by institutional investor buying or selling.


«Smart money» is buying US stocks during the downturn
Source: Bloomberg


There is a caveat though. The Smart Money Flow Index can give false signals in a bear market, as short sellers tend to close out their positions at the end of the trading day (i.e. in the last 30 minutes), briefly driving the market higher.


Chart #6 - The credit market at the breaking point?

High yield bond markets continued to fall last week, with the High Yield Corporate Bond ETF (HYG) falling to its lowest level since March 2020. At that time, the Fed had stepped in to support the debt market and bought bonds for considerable amounts. This is not the priority of the monetary authorities at the moment, as the Fed now seems determined to fight inflation even at the expense of the financial markets. The lack of a Fed put is perhaps the biggest stress on the markets right now.


The credit market at the breaking point?
Source: Bloomberg
 

Chart #7 - Is the bitcoin oversold?

Bitcoin (-30%) had its worst week since March 2020 to reach the psychological threshold of $20,000. An important support that did not hold over the weekend as Bitcoin even fell below $20,000 due to cascading forced liquidations.

Ethereum saw an even bigger drop, losing 35% last week alone. At issue is the liquidity crisis that is currently plaguing several "crypto lenders".

With regards to Bitcoin, it would appear that the leading cryptocurrency has never been so oversold (see RSI indicator below).


Is the bitcoin oversold?
Source: Bloomberg


Disclaimer

This marketing document has been issued by Bank Syz Ltd. It is not intended for distribution to, publication, provision or use by individuals or legal entities that are citizens of or reside in a state, country or jurisdiction in which applicable laws and regulations prohibit its distribution, publication, provision or use. It is not directed to any person or entity to whom it would be illegal to send such marketing material. This document is intended for informational purposes only and should not be construed as an offer, solicitation or recommendation for the subscription, purchase, sale or safekeeping of any security or financial instrument or for the engagement in any other transaction, as the provision of any investment advice or service, or as a contractual document. Nothing in this document constitutes an investment, legal, tax or accounting advice or a representation that any investment or strategy is suitable or appropriate for an investor's particular and individual circumstances, nor does it constitute a personalized investment advice for any investor. This document reflects the information, opinions and comments of Bank Syz Ltd. as of the date of its publication, which are subject to change without notice. The opinions and comments of the authors in this document reflect their current views and may not coincide with those of other Syz Group entities or third parties, which may have reached different conclusions. The market valuations, terms and calculations contained herein are estimates only. The information provided comes from sources deemed reliable, but Bank Syz Ltd. does not guarantee its completeness, accuracy, reliability and actuality. Past performance gives no indication of nor guarantees current or future results. Bank Syz Ltd. accepts no liability for any loss arising from the use of this document.

Read More

Straight from the Desk

Syz the moment

Live feeds, charts, breaking stories, all day long.

Thinking out loud

Sign up for our weekly email highlighting the most popular posts.

Follow us

Thinking out loud

Investing with intelligence

Our latest research, commentary and market outlooks